Fibonacci numbers, when applied in technical analysis through Fibonacci retracement and Fibonacci extension, are one of the most prolific techniques traders use to qualify or disqualify forex trades. In this article, we’ll look at how both retracement and extension work, and how you can use them in your own trading.
Fibonacci retracement
Fibonacci retracement is typically used to enter trades. By analysing the highs and lows of previous market moves, traders can predict how far a price might retrace the given move.
The idea is that during a new trend direction, a price will retrace back to a previous price level before resuming in the direction of its trend.
Fibonacci retracement has potential levels where a price can reverse from. The retracement levels are 23.6%, 38.2%, 61.8%, and 78.6%. Although not officially a Fibonacci ratio, 50% is also used. These percentages indicate how much of a prior move the price has retraced.
Using Fibonacci retracements - During an uptrend
To measure the Fibonacci retracement during an uptrend:
- Find a Swing Low point
- Find a Swing High point
Use the Fibonacci tool to draw the retracement from the Swing Low to the Swing High.
For example, this is the 4-hour chart for EUR/USD on April 12.
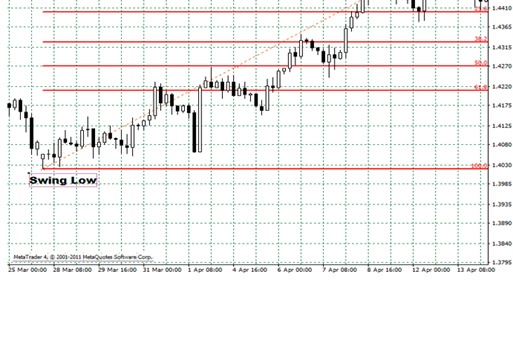
In the chart above, the Fibonacci retracement levels are plotted using the Swing Low at 1.4020 on March 27 and the Swing High at 1.4520 on April 12. The retracement levels are 1.4402 (23.6%), 1.4329 (38.2%), 1.4270 (50%), and 1.4211 (61.8%).
In the example above, the EUR/USD enjoyed a bullish trend before it began to retrace and move lower after reaching the high at 1.4520. With retracement during an uptrend, the expectation is that if EUR/USD retraces from this recent high at 1.4520, it will find support at one of the Fibonacci retracement levels where it will reverse up from.
Let’s look at what happened after the Swing High occurred on April 12. The following chart shows what happened to the EUR/USD chart up to April 19.
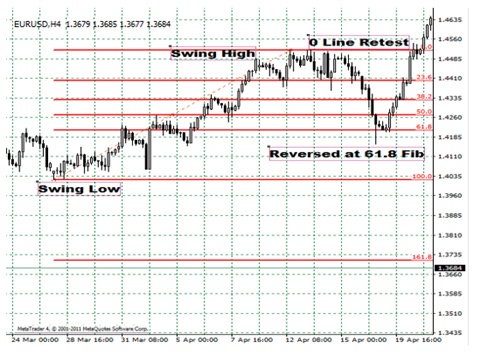
The price broke through the 23.6% level and carried on to the 38.2% and 50% levels. The price even got to the 61.8% level although it did not quite manage to break it. The price found support at 61.8% and buying at this Fibonacci level would have been a profitable long-term trade.
Takeaway: Retracements can be used to identify potential support levels. During an uptrend, the general rule is to buy on a retracement at a Fibonacci support level.
During a downtrend
Continuing with the above example, on April 21, the EUR/USD continued past its former Swing High and reached a new high at 1.4648. However, the same day the EUR/USD had a big move up, the USD/CHF had a big move down.
To measure the Fibonacci retracement during a downtrend, you do the opposite of what you do during an uptrend.
- find a Swing High point
- find a Swing Low point
- draw the retracement from the Swing High to the Swing Low
The following is a 4-hour chart of USD/CHF on April 21 showing the Fibonacci retracement during a downtrend.
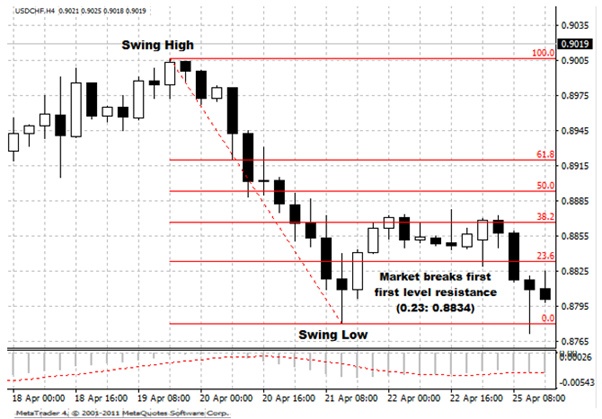
The Swing High is at 0.9008 on April 19 and the Swing Low is at 0.8780 on April 21. The retracement levels are 0.8834 (23.6%), 0.8866 (38.2%), 0.8894 (50%), and 0.8920 (61.8%).
The expectation during a downtrend is that if the price retraces from its Swing Low, it could possibly encounter resistance at one of the Fibonacci levels as traders are waiting to sell at these levels.
In the above example, the price broke through the 23.6% level with a bullish candlestick and even managed to get to the 38.2% level, although barely. If a trader had some orders at either of the two levels, they may have made some pips on the trade.
Takeaway: Retracements can be used to identify potential resistance levels. During a downtrend, the general rule is to sell on a retracement at a Fibonacci resistance level.
Fibonacci extension
While Fibonacci retracement identifies levels that prices will retrace to, Fibonacci extension projects the direction of the move a price is likely to make in future. Traders typically use Fibonacci extensions to project good take-profit levels. Common Fibonacci extension levels are 61.8%, 100%, 161.8%, 200%, and 261.8%
In the previous example of the EUR/USD, the price passed the previous Swing High and made a new high at 1.4648. But what if the new Swing High gives way? Where to take profit becomes the big question.
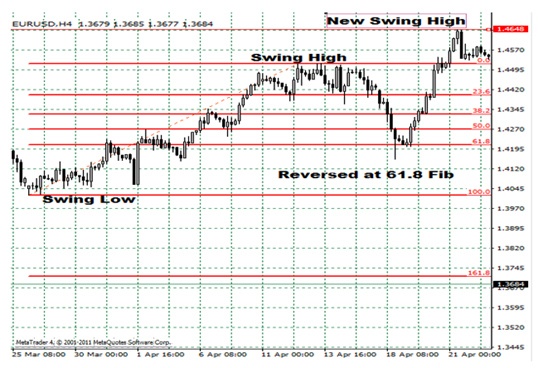
If we use the Fibonacci extension tool, we can see the levels that would have been good to take a profit. Using the EUR/USD example, we measure from the Low Swing to the High Swing then also to the retracement level.
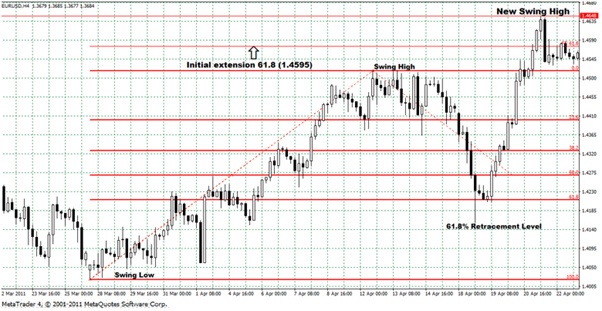
The extension tool creates a Fibonacci projection in the direction of the swing, marking potential take-profit levels. In the example above, we can see that although the market made a brief high at 1.4648, it turned out that the initial extension level at 61.8% would have been the best level to take profit.
Getting started with Fibonacci retracement and extension
The Fibonacci tool is just a tool and using it won’t magically make you a good trader if you aren’t already one. You have to know how to use retracement and extension levels in combination with other tools to help you make good trades.
In addition to the knowledge you also need to remember that:
The Fibonacci tool works best with obvious price moves. Don’t force trends where there are none and if you have to ask if there’s a trend, there probably isn’t.
Retracement and extension levels signal areas where a price can potentially find support and resistance but they shouldn’t be relied on exclusively.
Your choice of trading platform matters. For example, the MT4 trading platform is considered by many as the best trading platform for forex because it was specifically built for forex traders. The right platform will simplify your ability to use retracement and extension levels.
Once you start combining Fibonacci levels, price action analysis, and other indicators with discipline and practice, you may start creating some profitable trading opportunities.
This material on this website is intended for illustrative purposes and general information only. It does not constitute financial advice nor does it take into account your investment objectives, financial situation or particular needs. Commission, interest, platform fees, dividends, variation margin and other fees and charges may apply to financial products or services available from FP Markets. The information in this website has been prepared without taking into account your personal objectives, financial situation or needs. You should consider the information in light of your objectives, financial situation and needs before making any decision about whether to acquire or dispose of any financial product. Contracts for Difference (CFDs) are derivatives and can be risky; losses can exceed your initial payment and you must be able to meet all margin calls as soon as they are made. When trading CFDs you do not own or have any rights to the CFDs underlying assets.
FP Markets recommends that you seek independent advice from an appropriately qualified person before deciding to invest in or dispose of a derivative. A Product Disclosure Statement for each of the financial products is available from FP Markets can be obtained either from this website or on request from our offices and should be considered before entering into transactions with us. First Prudential Markets Pty Ltd (ABN 16 112 600 281, AFS Licence No. 286354).
Editors’ Picks

EUR/USD holds lower ground near 1.1850 ahead of EU/ US data
EUR/USD remains in the negative territory for the fourth successive session, trading around 1.1850 in European trading on Friday. A broadly cautious market environment paired with modest US Dollar demand undermines the pair ahead of the Eurozone GDP second estimate and the critical US CPI data.

GBP/USD keeps losses around 1.3600, awaits US CPI for fresh impetus
GBP/USD holds moderate losses at around 1.3600 in the European session on Friday, though it lacks bearish conviction. The US Dollar remains supported amid softer risk tone and ahead of the US consumer inflation figures due later in the NA session on Friday.

USD/JPY rebounds above 153.00 ahead of US inflation data
USD/JPY stages a comeback and regains 153.00 in the Asian session, snapping a four-day losing streak amid some repositioning ahead of the US CPI report. However, expectations that Japan's PM Sanae Takaichi could be more fiscally responsible, along with bets that the BoJ will stick to its policy normalization path and the risk-off mood, could support the safe-haven Japanese Yen, capping the pair's upside.
Editors’ Picks
EUR/USD holds lower ground near 1.1850 ahead of EU/ US data
EUR/USD remains in the negative territory for the fourth successive session, trading around 1.1850 in European trading on Friday. A broadly cautious market environment paired with modest US Dollar demand undermines the pair ahead of the Eurozone GDP second estimate and the critical US CPI data.
GBP/USD keeps losses around 1.3600, awaits US CPI for fresh impetus
GBP/USD holds moderate losses at around 1.3600 in the European session on Friday, though it lacks bearish conviction. The US Dollar remains supported amid softer risk tone and ahead of the US consumer inflation figures due later in the NA session on Friday.

Gold trims intraday gains to $5,000 as US inflation data loom
Gold retreats from the vicinity of the $5,000 psychological mark, though sticks to its modest intraday gains heading into the European session. Traders now look forward to the release of the US consumer inflation figures for more cues about the Fed policy path. The outlook will play a key role in influencing the near-term US Dollar price dynamics and provide some meaningful impetus to the non-yielding bullion.

Solana: Mixed market sentiment caps recovery
Solana is trading at $79 as of Friday, following a correction of over 9% so far this week. On-chain and derivatives data indicates mixed sentiment among traders, further limiting the chances of a price recovery.

A tale of two labour markets: Headline strength masks underlying weakness
Undoubtedly, yesterday’s delayed US January jobs report delivered a strong headline – one that surpassed most estimates. However, optimism quickly faded amid sobering benchmark revisions.
RECOMMENDED LESSONS
Making money in forex is easy if you know how the bankers trade!
I’m often mystified in my educational forex articles why so many traders struggle to make consistent money out of forex trading. The answer has more to do with what they don’t know than what they do know. After working in investment banks for 20 years many of which were as a Chief trader its second knowledge how to extract cash out of the market.
5 Forex News Events You Need To Know
In the fast moving world of currency markets where huge moves can seemingly come from nowhere, it is extremely important for new traders to learn about the various economic indicators and forex news events and releases that shape the markets. Indeed, quickly getting a handle on which data to look out for, what it means, and how to trade it can see new traders quickly become far more profitable and sets up the road to long term success.
Top 10 Chart Patterns Every Trader Should Know
Chart patterns are one of the most effective trading tools for a trader. They are pure price-action, and form on the basis of underlying buying and selling pressure. Chart patterns have a proven track-record, and traders use them to identify continuation or reversal signals, to open positions and identify price targets.
7 Ways to Avoid Forex Scams
The forex industry is recently seeing more and more scams. Here are 7 ways to avoid losing your money in such scams: Forex scams are becoming frequent. Michael Greenberg reports on luxurious expenses, including a submarine bought from the money taken from forex traders. Here’s another report of a forex fraud. So, how can we avoid falling in such forex scams?
What Are the 10 Fatal Mistakes Traders Make
Trading is exciting. Trading is hard. Trading is extremely hard. Some say that it takes more than 10,000 hours to master. Others believe that trading is the way to quick riches. They might be both wrong. What is important to know that no matter how experienced you are, mistakes will be part of the trading process.
The challenge: Timing the market and trader psychology
Successful trading often comes down to timing – entering and exiting trades at the right moments. Yet timing the market is notoriously difficult, largely because human psychology can derail even the best plans. Two powerful emotions in particular – fear and greed – tend to drive trading decisions off course.