![]() Gabe Velázquez
Gabe Velázquez
Online Trading Academy
Of all the facets of trading, the first a novice trader must learn before he can engage the markets with any degree of confidence is identifying low risk entry points on a price chart. Notice that not just any entry will do, only those offering the biggest reward for the least amount of capital exposed are acceptable.
If you’ve ever read about or had the chance to chat with any successful trader, you’ll find a common thread: They all (without exception) have an edge based on low risk entries and consistently execute those entries.
What defines a low risk entry? The price level where a trader can expose the least amount of capital to prove whether his edge will work. I tell students to look for these areas by identifying “the line in the sand” or “drop-dead level” where price has to hold. These are generally found at prior inflection points on the chart.
Specifically, inflection points can be spotted by looking for those price levels where there was a clear change of direction. In other words, where was the dominance of either the buyers or sellers relinquished? Moreover, the more powerful the reversal, the more important that point becomes on the retest.
Also noteworthy is the fact that the first time these levels were “tested,” not only did they provide low risk trade setups, but they also held, and reversed a high percentage of the time.
I’ve used the chart of the British Pound futures below to illustrate this premise.
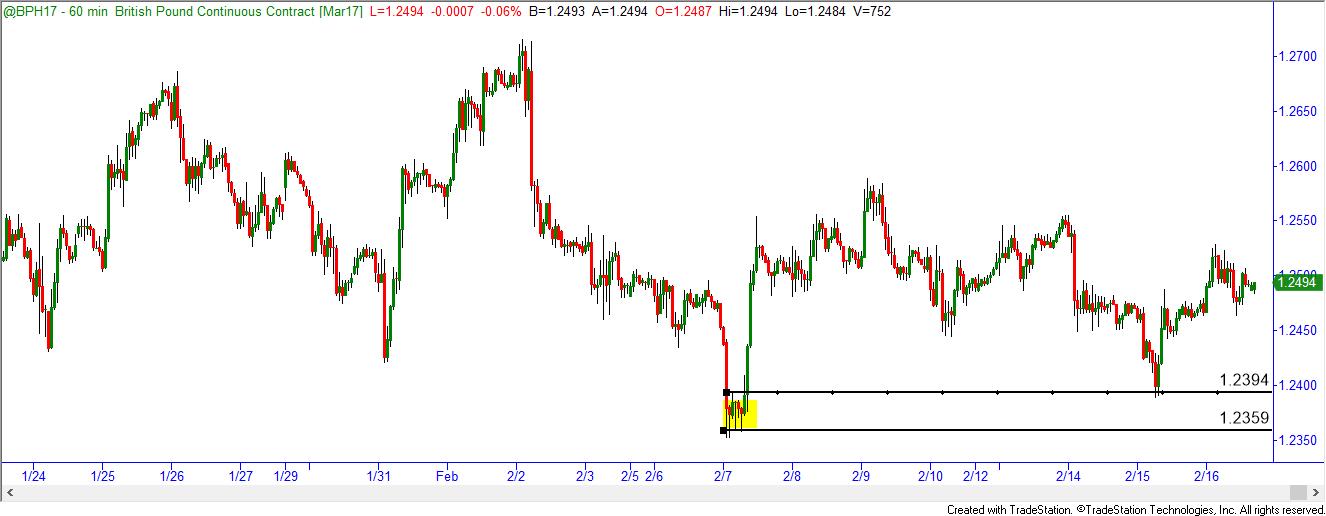
Depending on how much risk one is comfortable in assuming, a limit order can be placed at the line where prices formed a zone before turning and a stop slightly below the “drop dead ” line . In this chart, we can see how fast the British Pound was falling before it reversed. This is where the lowest risk entry point was found in this trade.
In the second example, AD (Australian Dollar Futures) in the chart below was falling sharply, this is signaling an extended market in which the odds of a reversal are heightened. If we look to the right, we can see previous inflection points (highlighted in yellow). These would be deemed areas that would attract buyers. Given that we know (based on our scoring system) that there is very high probability of price holding at that zone, and our risk will is modest, we have to execute a trade against that zone.
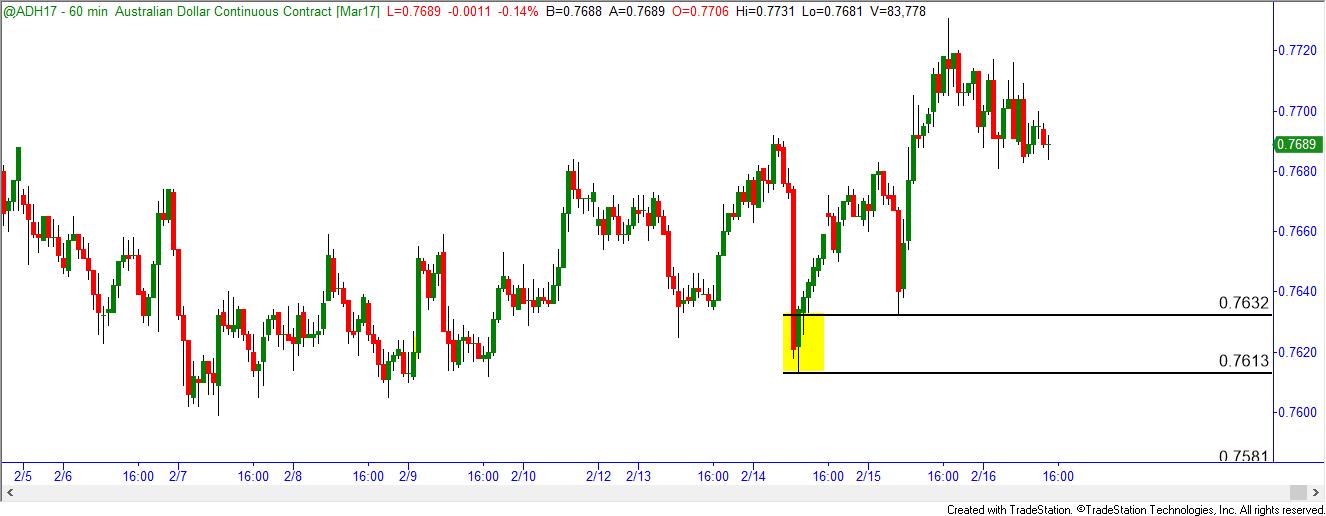
As we can see in the chart, the zone held, and the trade worked nicely.
Suffice it to say, not all trades will work as well as these did, but the key here is when they don’t pan out, the losses will be minimal compared to the profit potential.
Once a trader learns the skill of identifying these levels, the biggest challenge is putting on the trades. Why do I say this? Well, all of these trades are being placed when price is either retracing or the market is moving strongly into one of these areas.
If you look closely at the two chart examples, in both trades you were buying into a series of red candles and the trend was lower; psychologically, this doesn’t sit well with most non-professional traders. Only by knowing probabilities and accepting risk can a trader place these trades with a high degree of self-assurance.
The other issue is patience. These setups don’t come about every minute, or five minutes for that matter – more like two or three times on some days.
Indeed, this style of trading perhaps is not for everyone, but regardless of your method, identifying and executing low risk entries are the hallmark of a consistently profitable trader.
Until next time, I hope everyone has a great trading week.
This content is intended to provide educational information only. This information should not be construed as individual or customized legal, tax, financial or investment services. As each individual's situation is unique, a qualified professional should be consulted before making legal, tax, financial and investment decisions. The educational information provided in this article does not comprise any course or a part of any course that may be used as an educational credit for any certification purpose and will not prepare any User to be accredited for any licenses in any industry and will not prepare any User to get a job. Reproduced by permission from OTAcademy.com click here for Terms of Use: https://www.otacademy.com/about/terms
Editors’ Picks

EUR/USD climbs to two-week highs beyond 1.1900
EUR/USD is keeping its foot on the gas at the start of the week, reclaiming the 1.1900 barrier and above on Monday. The US Dollar remains on the back foot, with traders reluctant to step in ahead of Wednesday’s key January jobs report, allowing the pair to extend its upward grind for now.

GBP/USD hits three-day peaks, targets 1.3700
GBP/USD is clocking decent gains at the start of the week, advancing to three-day highs near 1.3670 and building on Friday’s solid performance. The better tone in the British Pound comes on the back of the intense sekk-off in the Greenback and despite re-emerging signs of a fresh government crisis in the UK.

USD/JPY recedes to multi-day lows near 155.50
USD/JPY is pulling back sharply at the start of the week, slipping back toward the 155.50 area as speculation mounts that authorities could step in to rein in further Yen weakness. That narrative gained traction after PM S. Takaichi secured a landslide victory in Sunday’s election, stoking expectations of a tougher line in defence of the domestic currency.
Editors’ Picks
EUR/USD climbs to two-week highs beyond 1.1900
EUR/USD is keeping its foot on the gas at the start of the week, reclaiming the 1.1900 barrier and above on Monday. The US Dollar remains on the back foot, with traders reluctant to step in ahead of Wednesday’s key January jobs report, allowing the pair to extend its upward grind for now.
USD/JPY recedes to multi-day lows near 155.50
USD/JPY is pulling back sharply at the start of the week, slipping back toward the 155.50 area as speculation mounts that authorities could step in to rein in further Yen weakness. That narrative gained traction after PM S. Takaichi secured a landslide victory in Sunday’s election, stoking expectations of a tougher line in defence of the domestic currency.

Gold treads water around $5,000
Gold is trading in an inconclusive fashion around the key $5,000 mark on Monday week. Support is coming from fresh signs of further buying from the PBoC, while expectations that the Fed could turn more dovish, alongside concerns over its independence, keep the demand for the precious metal running.

Crypto Today: Bitcoin steadies around $70,000, Ethereum and XRP remain under pressure
Bitcoin hovers around $70,000, up near 15% from last week's low of $60,000 despite low retail demand. Ethereum delicately holds $2,000 support as weak technicals weigh amid declining futures Open Interest. XRP seeks support above $1.40 after facing rejection at $1.54 during the previous week's sharp rebound.

Japanese PM Takaichi nabs unprecedented victory – US data eyed this week
I do not think I would be exaggerating to say that Japanese Prime Minister Sanae Takaichi’s snap general election gamble paid off over the weekend – and then some. This secured the Liberal Democratic Party (LDP) an unprecedented mandate just three months into her tenure.
RECOMMENDED LESSONS
Making money in forex is easy if you know how the bankers trade!
I’m often mystified in my educational forex articles why so many traders struggle to make consistent money out of forex trading. The answer has more to do with what they don’t know than what they do know. After working in investment banks for 20 years many of which were as a Chief trader its second knowledge how to extract cash out of the market.
5 Forex News Events You Need To Know
In the fast moving world of currency markets where huge moves can seemingly come from nowhere, it is extremely important for new traders to learn about the various economic indicators and forex news events and releases that shape the markets. Indeed, quickly getting a handle on which data to look out for, what it means, and how to trade it can see new traders quickly become far more profitable and sets up the road to long term success.
Top 10 Chart Patterns Every Trader Should Know
Chart patterns are one of the most effective trading tools for a trader. They are pure price-action, and form on the basis of underlying buying and selling pressure. Chart patterns have a proven track-record, and traders use them to identify continuation or reversal signals, to open positions and identify price targets.
7 Ways to Avoid Forex Scams
The forex industry is recently seeing more and more scams. Here are 7 ways to avoid losing your money in such scams: Forex scams are becoming frequent. Michael Greenberg reports on luxurious expenses, including a submarine bought from the money taken from forex traders. Here’s another report of a forex fraud. So, how can we avoid falling in such forex scams?
What Are the 10 Fatal Mistakes Traders Make
Trading is exciting. Trading is hard. Trading is extremely hard. Some say that it takes more than 10,000 hours to master. Others believe that trading is the way to quick riches. They might be both wrong. What is important to know that no matter how experienced you are, mistakes will be part of the trading process.
The challenge: Timing the market and trader psychology
Successful trading often comes down to timing – entering and exiting trades at the right moments. Yet timing the market is notoriously difficult, largely because human psychology can derail even the best plans. Two powerful emotions in particular – fear and greed – tend to drive trading decisions off course.