![]() Russ Allen
Russ Allen
Online Trading Academy
The price of an option changes as the price of its underlying stock changes, but the relationship is not one to one. In fact, the ratio of an option price to its stock price continuously changes and can be calculated using option software.
Because the ratio of stock price to option price is not constant, option traders need a tool to project what an option’s price will be if the underlying stock price reaches its target (or reaches a stop-loss price). The Option Profit/Loss Graph is that tool. It shows how much profit or loss a particular option position would be expected to make at any given stock price. Here’s a description of how to set up an option profit/loss graph and use it from the perspective of an option buyer.
In the linked example, the investor was contemplating buying a Call option on SPY, the exchange-traded fund that tracks the S&P 500 index.
In that example SPY had closed the day at $332 per share, and the trader believed that it would go up further in the next few weeks (not a recommendation, just a for-instance).
He saw that there were call options at the $330 strike price that were to expire in fourteen days. Each call option represented the right to buy 100 shares of SPY at $330 at any time in following two weeks. The price of the options at that time was $3.00 per share, or $300 per option contract.
The trader needed to know, if he bought the calls at their $3.00 per share price, how much money he could make if SPY went up, by say $4.00 per share or some other amount.
The option buyer’s P/L graph looked like this:
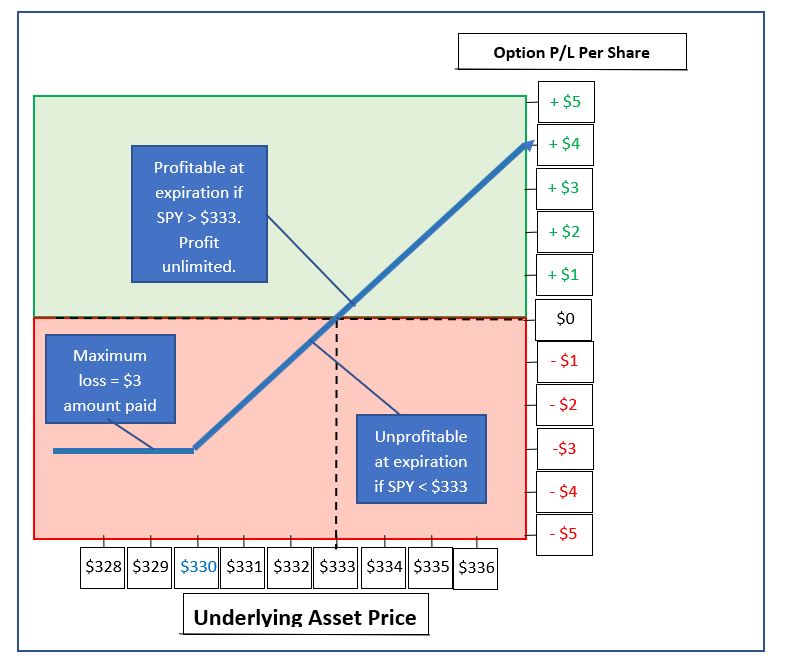
For the trader to make any money at all if he held the option until expiration, SPY would have to be at a price of at least $333.01 per share at that time. If it were, then the trader’s total investment of $333 per share ($3.00 for the option plus $330 for the stock) would be repaid. If SPY were to go up to a higher price, say $337, then the trader would have a profit of $337 – $333 or $4 per share on a $3 per share investment, all in 2 weeks.
Comparison of an Option Buy vs. Sell Position
If that trader (let’s call him Trader A) did rack up that $400 profit on his $300 investment, where would that $400 have come from?
The answer is that it would come indirectly from the person who sold the option to Trader A for $3.00.
Here’s how that would work. The option seller (let’s call him Trader B) sold the option for $300 because he did NOT believe that SPY would be above $330 per share when the option expired. If he were right, then there would be no reason for Trader A to exercise his option. Trader A would just let it go and chalk up a $300 loss. Trader B would keep the money, happily having made $300.
But what if Trader B were wrong and SPY did end up at $337?
Well, in exchange for the $300 in cash that he received when he sold the call, Trader B took on the obligation to deliver the SPY shares to Trader A, whenever Trader A ordered him to (if ever). In that event, Trader B agreed that he would accept $330 per share in payment. This movement of cash and shares would be handled by Trader A and Trader B’s respective brokers with no interaction between the traders themselves.
So, when Trader A decides to exercise his option, he phones his broker; who contacts the central option clearing house; who contacts Trader B’s Broker; who takes 100 shares of SPY out of Trader B’s account and delivers them to trader A. Trader A’s account is charged $330 per share ($33,000 in total), which is delivered to Trader B.
So, where does Trader B now stand? He originally collected $300 for selling the option. He just now collected another $33,000 from Trader A. He has received a total of $33,300 in cash from Trader A.
But wait – he just had to deliver 100 shares of SPY, which he did not have. His broker borrowed those shares on his behalf so that they could be delivered to Trader A. Trader B now owes those 100 shares of SPY to his broker. To acquire them, he must buy them in the open market at the current price, which is $337 per share, or $33,700 total.
In the end, Trader B took in $33,300 in cash, and paid out $33,700 in cash, for a net loss of $400 – the same $400 ($4.00 per share of SPY) that was Trader A’s profit.
Comparison of an Option Buy vs. Option Sell Profit/Loss Graph
What does Trader B’s profit graph look like?
Here it is:
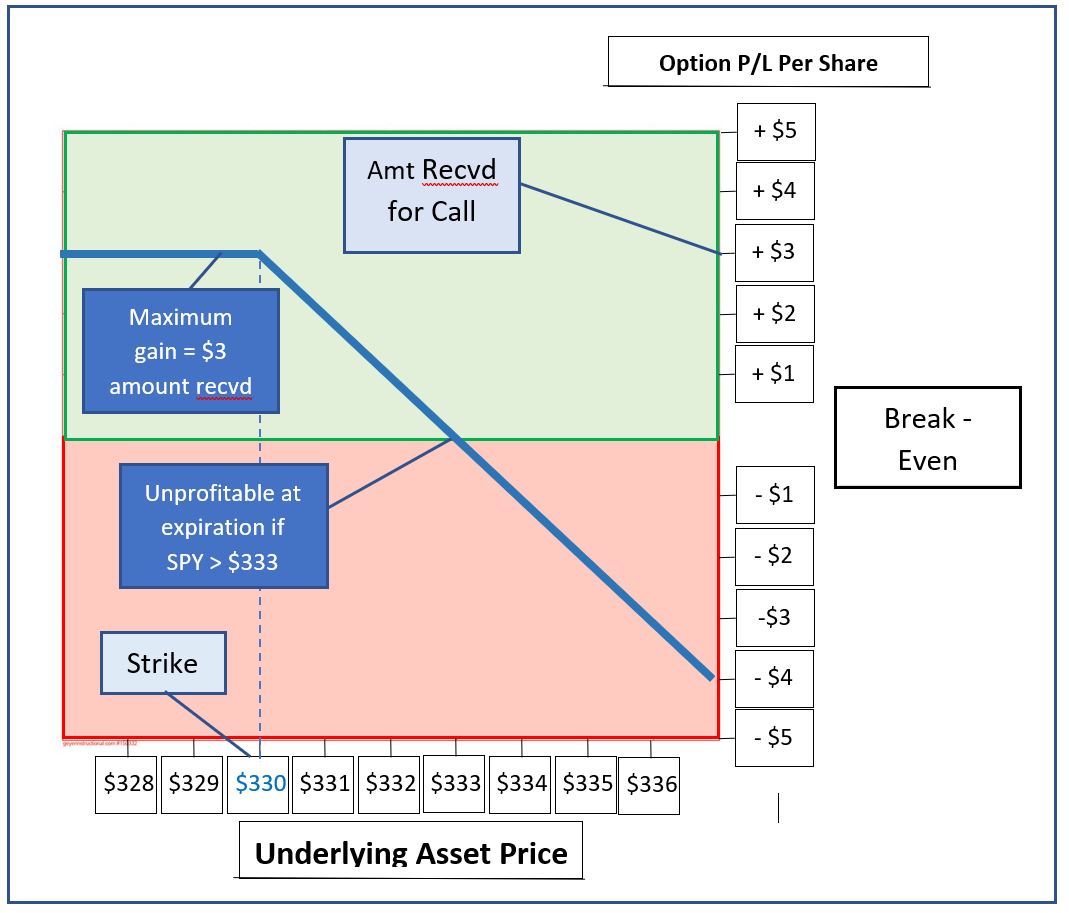
His graph shows that his SPY break-even price of $333 is the same as Trader A’s.
Trader B’s maximum profit is the $3 per share that he originally collected. Note that this same $300 is Trader A’s maximum loss.
Trader B has a loss of $4 per share if the Underlying Asset Price (SPY price) is at $337 at expiration. This is the same $4 per share that Trader A gained in that case.
And if SPY were higher than $337 at the option’s expiration, then Trader A would make even more money. All of that additional money would come out of Trader B’s pocket, with no limit.
If you look at both P/L graphs next to each other, you will see that Trader B’s situation is an exact mirror image of Trader A’s, with the graph rotated top to bottom around the break-even line. At any given Underlying Asset Price, one of the two makes a profit, and the other makes a loss of the same amount.
I hope this simple example has helped you to understand how useful the P/L Graph and its associated calculations are. The graph lets us visualize just what we can expect when the underlying asset price changes. With a little practice, reading these charts becomes second nature for option traders.
This content is intended to provide educational information only. This information should not be construed as individual or customized legal, tax, financial or investment services. As each individual's situation is unique, a qualified professional should be consulted before making legal, tax, financial and investment decisions. The educational information provided in this article does not comprise any course or a part of any course that may be used as an educational credit for any certification purpose and will not prepare any User to be accredited for any licenses in any industry and will not prepare any User to get a job. Reproduced by permission from OTAcademy.com click here for Terms of Use: https://www.otacademy.com/about/terms
Editors’ Picks

EUR/USD trims gains, back below 1.1800
EUR/USD now loses some upside momentum, returning to the area below the 1.1800 support as the Greenback manages to regain some composure following the SCOTUS-led pullback earlier in the session.

GBP/USD off highs, recedes to the sub-1.3500 area
Following earlier highs north of 1.3500 the figure, GBP/USD now faces some renewed downside pressure, revisiting the 1.3490 zone as the US Dollar manages to regain some upside impulse in the latter part of the NA session on Friday.

USD/JPY sticks to gains above 155.00, over one-week top ahead of US data
The USD/JPY pair gains positive traction for the third straight day and climbs to over a one-week top, around the 155.35-155.40 region. Data released early today showed that Japan’s key inflation gauge eased to the slowest pace in two years, tempering expectations for an immediate policy tightening by the Bank of Japan.
Editors’ Picks

EUR/USD: US Dollar comeback in the makes? Premium
The US Dollar (USD) stands victorious at the end of another week, with the EUR/USD pair trading near a four-week low of 1.1742, while the USD retains its strength despite some discouraging American data released at the end of the week.

Gold: Escalating geopolitical tensions help limit losses Premium
Gold (XAU/USD) struggled to make a decisive move in either direction this week as it quickly recovered above $5,000 after posting losses on Monday and Tuesday.

GBP/USD: Pound Sterling braces for more pain, as 200-day SMA tested Premium
The Pound Sterling (GBP) crashed to its lowest level in a month against the US Dollar (USD), as critical support levels were breached in a data-packed week.

Bitcoin: No recovery in sight
Bitcoin (BTC) price continues to trade within a range-bound zone, hovering around $67,000 at the time of writing on Friday, and falling slightly so far this week, with no signs of recovery.

US Dollar: Tariffed. Now What? Premium
The US Dollar (USD) reversed its previous week’s decline, managing to stage a meaningful rebound and retesting the area just above the 98.00 barrier when tracked by the US Dollar Index (DXY).
RECOMMENDED LESSONS
Making money in forex is easy if you know how the bankers trade!
I’m often mystified in my educational forex articles why so many traders struggle to make consistent money out of forex trading. The answer has more to do with what they don’t know than what they do know. After working in investment banks for 20 years many of which were as a Chief trader its second knowledge how to extract cash out of the market.
5 Forex News Events You Need To Know
In the fast moving world of currency markets where huge moves can seemingly come from nowhere, it is extremely important for new traders to learn about the various economic indicators and forex news events and releases that shape the markets. Indeed, quickly getting a handle on which data to look out for, what it means, and how to trade it can see new traders quickly become far more profitable and sets up the road to long term success.
Top 10 Chart Patterns Every Trader Should Know
Chart patterns are one of the most effective trading tools for a trader. They are pure price-action, and form on the basis of underlying buying and selling pressure. Chart patterns have a proven track-record, and traders use them to identify continuation or reversal signals, to open positions and identify price targets.
7 Ways to Avoid Forex Scams
The forex industry is recently seeing more and more scams. Here are 7 ways to avoid losing your money in such scams: Forex scams are becoming frequent. Michael Greenberg reports on luxurious expenses, including a submarine bought from the money taken from forex traders. Here’s another report of a forex fraud. So, how can we avoid falling in such forex scams?
What Are the 10 Fatal Mistakes Traders Make
Trading is exciting. Trading is hard. Trading is extremely hard. Some say that it takes more than 10,000 hours to master. Others believe that trading is the way to quick riches. They might be both wrong. What is important to know that no matter how experienced you are, mistakes will be part of the trading process.
The challenge: Timing the market and trader psychology
Successful trading often comes down to timing – entering and exiting trades at the right moments. Yet timing the market is notoriously difficult, largely because human psychology can derail even the best plans. Two powerful emotions in particular – fear and greed – tend to drive trading decisions off course.