Stellar strategy guide: From NASDAQ to Gold price fluctuations, see how the sunspot cycle can guide your investment decisions. Discover how Gann Explained uses solar cycle insights to navigate the waters of Dow and beyond.
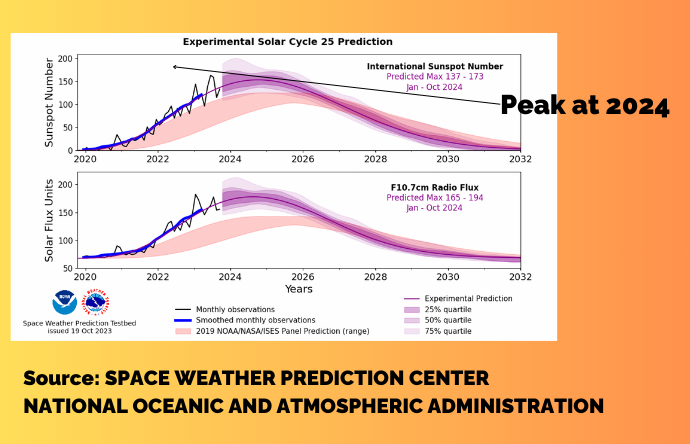
Are you aiming to elevate your stock market forecasting acumen by tapping into reliable cyclical patterns? This article could be the key to unlocking more profits. Unveiling the often-overlooked hidden market driver, solar cycle 25, we delve into its historical alignment of solar maximum and minimum of solar cycle 24 with pivotal market events, including the Dotcom Bubble and the Lehman Brothers collapse. With NOAA's latest projections indicating a peak for Solar Cycle 25 between January and October 2024, how would that impact the market?
This post delves into the intricate relationship between sunspot activity and market prices, challenging the oversimplified view of solar maximums and minimums as mere guiding US stock market trends or pivot triggers. We at Gann Explained explore the complexities of this relationship through historical data from solar cycles 21-24, offering insights into the potential market impacts of the ongoing solar cycle 25.
The solar cycle: An economic indicator in the sky?
The solar cycle spans roughly 11 years, with a peak activity around the 5th year. This cycle shifts between solar minimums, with fewer sunspots, and maximums, with more. Economist Irving Fisher, known for his debt deflation theory, posited a link between sunspots and economic fluctuations. He theorized that solar minimums might cause severe winters, impacting agriculture and food prices, with knock-on effects on the economy. Though Fisher's research was incomplete, it pointed to a potential influence of solar patterns on financial fluctuations.
A historical lens: Reflecting on solar cycles and economic milestones
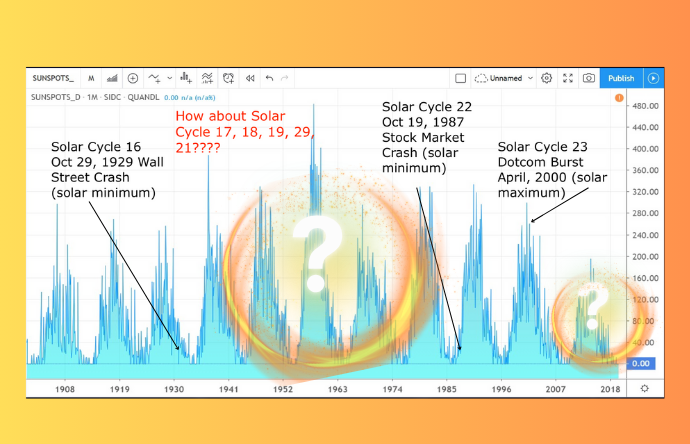
Solar cycle 16 and the 1929 Wall Street Crash: Coinciding with a solar maximum, this period marked the onset of the Great Depression.
Black Monday and solar cycle 22: The 1987 market crash happened during a solar minimum, witnessing the largest one-day percentage drop in DJIA history. This seismic shake-up serves as a reminder that market forces can align with or defy solar patterns in unexpected ways.
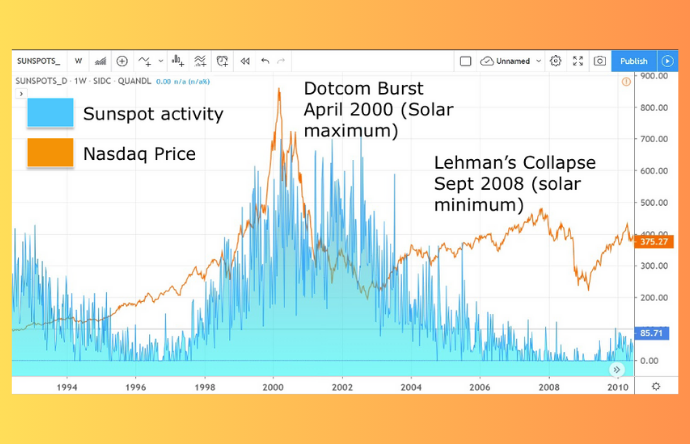
The Dot-com Bubble and solar cycle 23: Aligning with the solar maximum, the burst saw significant declines in major indices and stocks like Amazon.
Lehman Brothers' Collapse in solar cycle 24: Occurring at a solar minimum, this event set off a chain reaction across global markets.
The untold story of solar cycles 17-21 and deciphering the switch-off phenomenon
Do these cycles simply take a hiatus from influencing the market, or do they switch on and off at specific cycles? The absence of direct correlations in certain cycles with the stock market underscores a deeper complexity of how solar activity impacts economic fluctuations. For traders who have been decoding W.D. Gann's work, does it remind you of Marie's Appearance, Disappearance, and Reappearance in the Tunnel Thru the Air?
Debunking the myth: The real impact of solar cycles on market dynamics
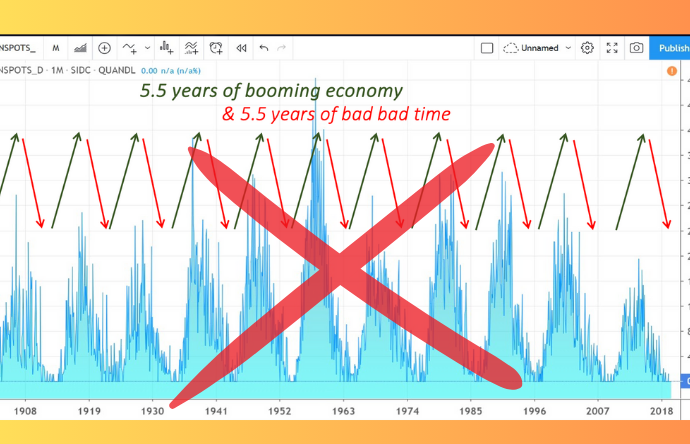
The notion that solar cycles dictate a rhythmic pattern of five years of economic growth, followed by an equal period of stock market decline, borders on the realm of fantasy, echoing an 'imaginary economy.' This concept of a predictable, clockwork-like economic pattern is far too orderly and simplistic for real-world economics. However, solar patterns do hold potential as a nuanced financial indicator.
Conclusion: Embracing the solar cycle and 2024 market trend
As we stand at the cusp of solar cycle 25's peak, it's clear that the solar maximum and minimum offer more than just astronomical intrigue; they present a unique lens through which we can forecast market trends. Our journey through the historical interplay between solar activity and economic milestones reveals a complex yet fascinating relationship that challenges traditional market analysis.
The nuanced role of solar activity, as showcased through events like the Dotcom Bubble and the Lehman Brothers collapse, invites a more sophisticated approach to financial forecasting.
In the upcoming post, I will reveal using solar cycle 25 in forecasting the 2024 market trend. Additionally, I'll detail the step-by-step process we employ at Gann Explained to integrate solar cycles into practical, actionable trading strategies in 2024.
Khit Wong and all members of Gann Explained LLC are NOT financial advisors, and nothing they say is meant to be a recommendation to buy or sell any financial instrument. All information is strictly educational and/or opinion. By reading this, you agree to all of the following: You understand this to be an expression of opinions and not professional advice. Any opinions, news, research, analysis, prices, or other information contained on this website is provided as general market commentary and education and does not constitute advice. The brand name of Gann Explained LLC will not accept liability for any loss or damage, including without limitation any loss of profit, which may arise directly or indirectly from the use of or reliance on such information. You are solely responsible for the use of any content and hold Khit Wong, Gann Explained LLC all members harmless in any event or claim. FTC DISCLOSURE: Any income claims shared by myself, students, friends, or clients are understood to be true and accurate but are not verified in any way. Always do your own due diligence and use your own judgment when making buying decisions and investments in your business.
Editors’ Picks

EUR/USD stays weak near 1.1850 after dismal German ZEW data
EUR/USD remains in the red near 1.1850 in the European session on Tuesday. A broad US Dollar bullish consolidation combined with a softer risk tone keep the pair undermined alongside downbeat German ZEW sentiment readings for February.

GBP/USD holds losees near 1.3600 after weak UK jobs report
GBP/USD is holding moderate losses near the 1.3600 level in Tuesday's European trading. The United Kingdom employment data suggested worsening labor market conditions, bolstering bets for a BoE interest rate cut next month. This narrative keeps the Pound Sterling under bearish pressure.

USD/JPY slides further below 153.00; eyes 200-day EMA amid a firmer JPY
The USD/JPY pair meets with a fresh supply on Tuesday and slides further below the 153.00 mark heading into the European session, reversing a major part of the previous day's positive move. Spot prices, however, manage to hold above the 200-day Exponential Moving Average support, around the 152.50 region, preserving a tentative bullish bias despite a shallow cushion.
Editors’ Picks
EUR/USD stays weak near 1.1850 after dismal German ZEW data
EUR/USD remains in the red near 1.1850 in the European session on Tuesday. A broad US Dollar bullish consolidation combined with a softer risk tone keep the pair undermined alongside downbeat German ZEW sentiment readings for February.
GBP/USD holds losees near 1.3600 after weak UK jobs report
GBP/USD is holding moderate losses near the 1.3600 level in Tuesday's European trading. The United Kingdom employment data suggested worsening labor market conditions, bolstering bets for a BoE interest rate cut next month. This narrative keeps the Pound Sterling under bearish pressure.

Gold pares intraday losses; keeps the red above $4,900 amid receding safe-haven demand
Gold (XAU/USD) attracts some follow-through selling for the second straight day and dives to over a one-week low, around the $4,858 area, heading into the European session on Tuesday.

Canada CPI expected to show sticky inflation in January, still above BoC’s target
Economists see the headline CPI rising by 2.4% in a year to January, still above the BoC’s target and matching December’s increase. On a monthly basis, prices are expected to rise by 0.1%.

UK jobs market weakens, bolstering rate cut hopes
In the UK, the latest jobs report made for difficult reading. Nonetheless, this represents yet another reminder for the Bank of England that they need to act swiftly given the collapse in inflation expected over the coming months.
RECOMMENDED LESSONS
Making money in forex is easy if you know how the bankers trade!
I’m often mystified in my educational forex articles why so many traders struggle to make consistent money out of forex trading. The answer has more to do with what they don’t know than what they do know. After working in investment banks for 20 years many of which were as a Chief trader its second knowledge how to extract cash out of the market.
5 Forex News Events You Need To Know
In the fast moving world of currency markets where huge moves can seemingly come from nowhere, it is extremely important for new traders to learn about the various economic indicators and forex news events and releases that shape the markets. Indeed, quickly getting a handle on which data to look out for, what it means, and how to trade it can see new traders quickly become far more profitable and sets up the road to long term success.
Top 10 Chart Patterns Every Trader Should Know
Chart patterns are one of the most effective trading tools for a trader. They are pure price-action, and form on the basis of underlying buying and selling pressure. Chart patterns have a proven track-record, and traders use them to identify continuation or reversal signals, to open positions and identify price targets.
7 Ways to Avoid Forex Scams
The forex industry is recently seeing more and more scams. Here are 7 ways to avoid losing your money in such scams: Forex scams are becoming frequent. Michael Greenberg reports on luxurious expenses, including a submarine bought from the money taken from forex traders. Here’s another report of a forex fraud. So, how can we avoid falling in such forex scams?
What Are the 10 Fatal Mistakes Traders Make
Trading is exciting. Trading is hard. Trading is extremely hard. Some say that it takes more than 10,000 hours to master. Others believe that trading is the way to quick riches. They might be both wrong. What is important to know that no matter how experienced you are, mistakes will be part of the trading process.
The challenge: Timing the market and trader psychology
Successful trading often comes down to timing – entering and exiting trades at the right moments. Yet timing the market is notoriously difficult, largely because human psychology can derail even the best plans. Two powerful emotions in particular – fear and greed – tend to drive trading decisions off course.