![]() Baruch Silvermann
Baruch Silvermann
The Smart Investor
It's not a secret:
Chart patterns are effective tools for traders to find profitable opportunities in the market.
Although several patterns exist, some patterns are more popular and tend to carry a higher probability of success than other patterns. The following four patterns fall into this category as they are widely known among experienced traders.
1. The Head and Shoulders Pattern
The head and shoulders pattern signals a reversal of trend. There are two variations of the pattern, offering trading opportunities both to the long and short side. The bearish version is referred to as a head and shoulders pattern while the bullish version is called an inverted head and shoulders pattern.
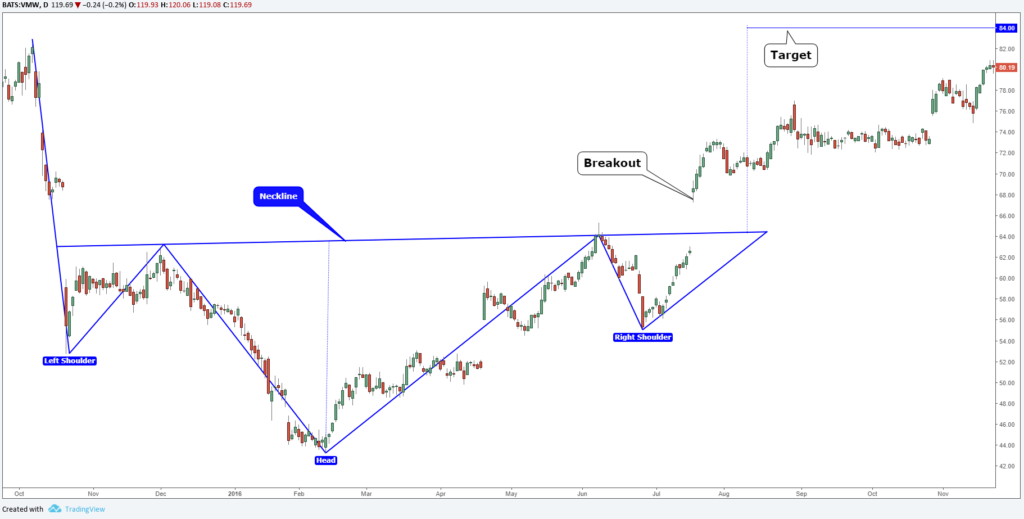
In the example of VMWare (VMW), an inverted head and shoulders pattern took place on a daily chart in late 2015 to early 2016.
There are four key points to note in identifying the pattern. The left shoulder, head, rights shoulder and neckline. Symmetry is important in this particular pattern and a general rule of thumb is that the better the symmetry, the higher the probability of the pattern playing out.
Let's explain:
In assessing symmetry, the low of the left shoulder should be similar or very close in price to the low of the right shoulder. The neckline should be a fairly straight horizontal line but a slight slant is acceptable. There are some examples where the neckline carries an angle or the two shoulders don’t align perfectly, but the theory behind the pattern is that the better the symmetry the more traders are likely to have spotted it, increasing the probability of the pattern playing out.
Trade With Head and Shoulders Pattern
In trading the head and shoulders or inverted head and shoulders pattern, traders wait for a sustained break of the neckline.
Where do we see it?
In the example of VMW, a break of the neckline came in the form of a gap up after the company reported better than expected earnings in July 2016. Often price will retest the neckline to offer a good entry point, however, with VMW the momentum created by the earnings report triggered a steady flow of buying that caused the stock to move straight to the target without retesting the neckline.
The target for a head and shoulders pattern is derived by taking a measurement from the head of the pattern to the neckline and then looking for an equal distance measured move starting from the neckline. A simple method in making this calculation is by drawing a line on a stock chart from the head to the neckline and then cloning that line and moving it to the neckline at the point of breakout, as illustrated in the above chart. The VMW head and shoulders pattern called for a target of roughly $84 which was reached in early 2017.
It is important for price to stay above the neckline once the pattern is activated. A sustained break back below it would invalidate the pattern.
2. The Flag Pattern
The flag pattern also comes in two varieties, a bullish and bearish variant named appropriately as a bull flag and bear flag. Unlike the head and shoulders pattern, however, this pattern looks for a continuation of trend.
The flag pattern is straightforward and easy to verify. It requires two lines with the same angle to be drawn around price action. There should be at least two points of contact for the highs and the low.
The example below shows a flag pattern that started in early August 2017 and took about a month to play out:
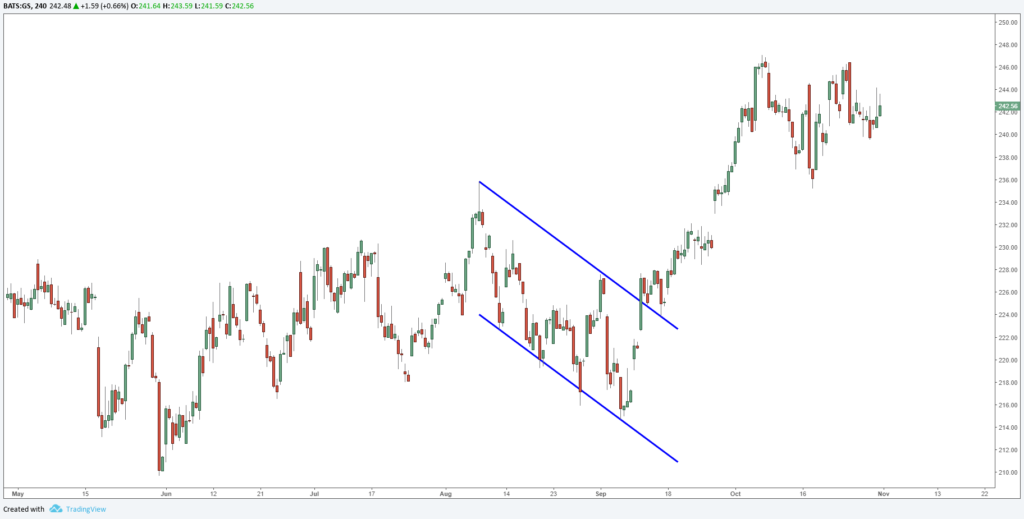
The Goldman Sachs flag pattern was drawn by connecting the high posted in early August with a high posted at the start of September. That line can then be cloned and pasted at the lows to create a channel. Actually, most charting platforms will have a channel tool, eliminating the need to clone trendlines.
Target For a Flag Pattern
The trading signal from the pattern comes following a sustained break of the upper bound of the channel in the example of the bullish variant.
In this case, there was a retest of the upper line which offers a good entry. Like all chart patterns, a retest is common but does necessarily always occur.
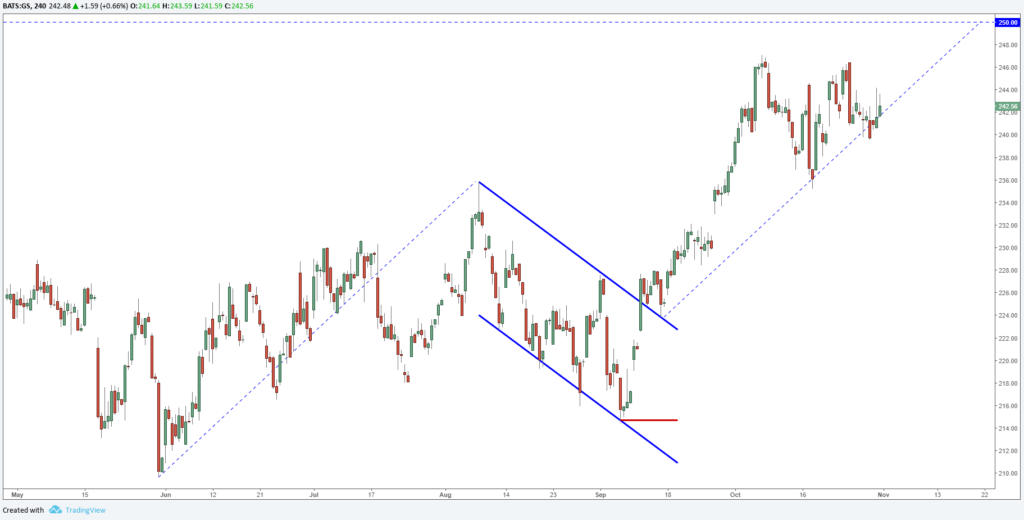
The target for a flag pattern is derived at by measuring the length of the bullish leg that proceeds the pattern and calculating an equal length from the point where the upper line of the pattern was breached. In the above example, similar to how a target was derived with the prior head and shoulders pattern, the method of cloning trendline was used.
Once an upside break occurs in a bullish flag pattern, price should remain above the upper line on a sustained basis. Traders will often enter with a stop below the last swing low, indicated by the red line in the above example. A sustained break back within the channel warrants closing the trade ahead of the stop as it suggests a weak pattern that is not likely to play out.
3. The Triangle Pattern
The triangle pattern is similar to the flag pattern as traders look for a technical break to signal a continuation of trend. The differentiating factor is that within a triangle, the trendlines converge.
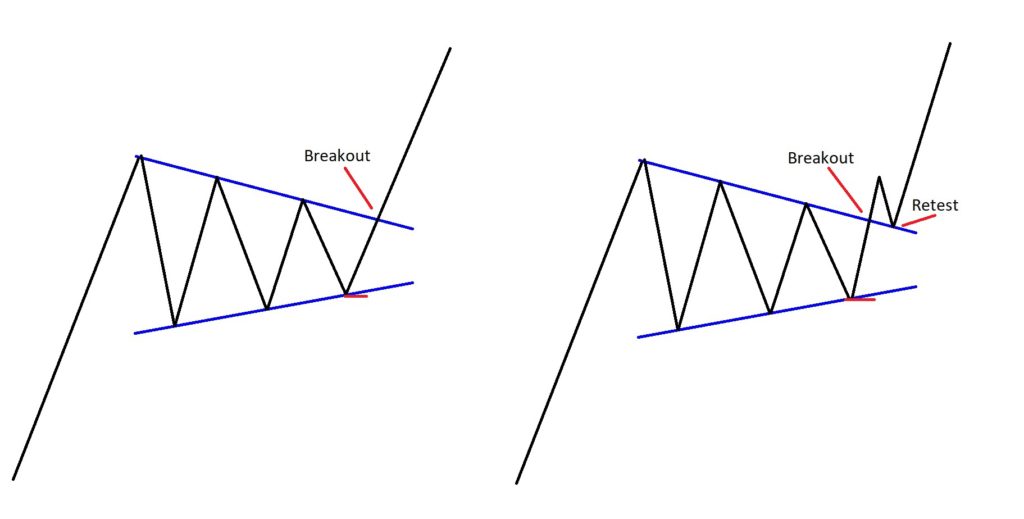
As with most patterns, there may or may not be a retest although the former is quite common. The above is an example of both scenarios.
Usually, there will be about three tests of both the upper and lower line, although the minimum is for two points of contact for each line. It is not uncommon for the very last decline in a bullish variant to fall slightly short of testing the rising trendline, as seen in the below example.
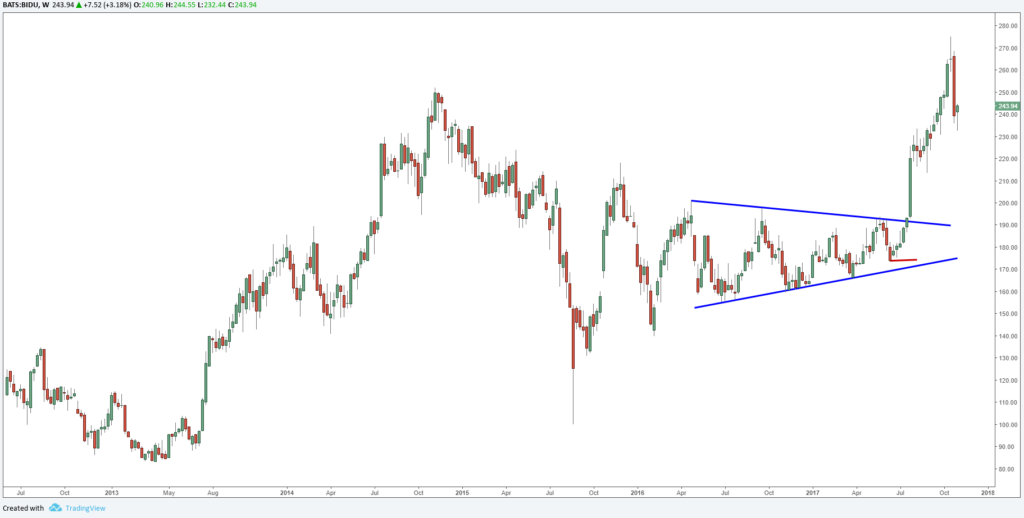
Traders will look for a sustained upside break to enter and will often place a stop below the prior swing low, marked in red in the above example. A sustained drop back within the triangle suggests a weak pattern and warrants closing the trade ahead of the stop.
Similar to the flag pattern, an equal legs measurement can be taken to derive at the target for the pattern.
4. The Double Top and Double Bottom
Double tops and double bottoms call for a turn of the trend. They often occur around important technical levels which create a big barrier, causing a reversal of trend or at least a correction. The main characteristic of this pattern is a minimum of two failed attempts at a level followed by a technical break in the opposite direction.
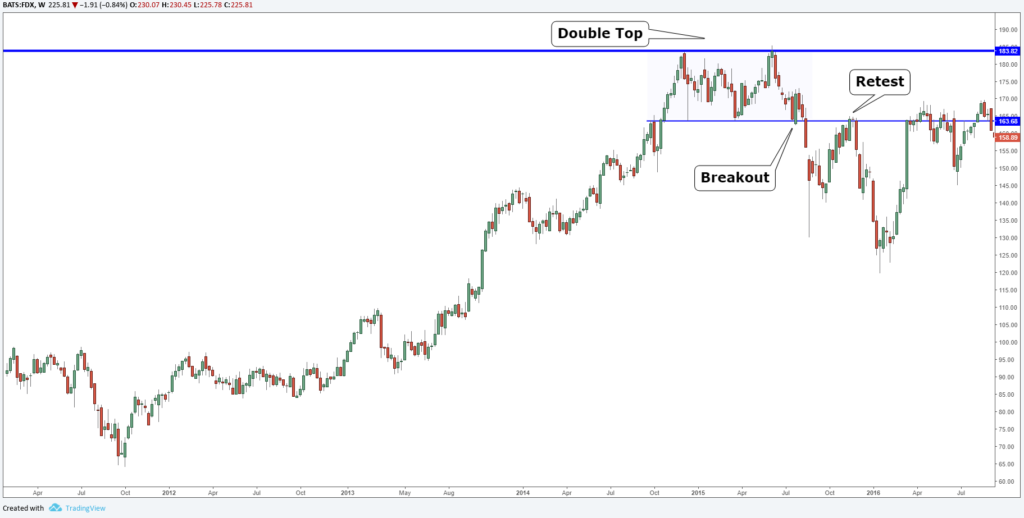
In the above example, FDX struggled at around the $184 price point in late 2014 and the first half of 2015. However, buyers stepped in to support dips towards the $164 price point. Eventually, there was a downside break of $164 in August 2015, confirming that a double top is in play.
In the above example, there was a retest of the breakdown point, offering a second opportunity to get involved in the trade for those that missed it the first time around.
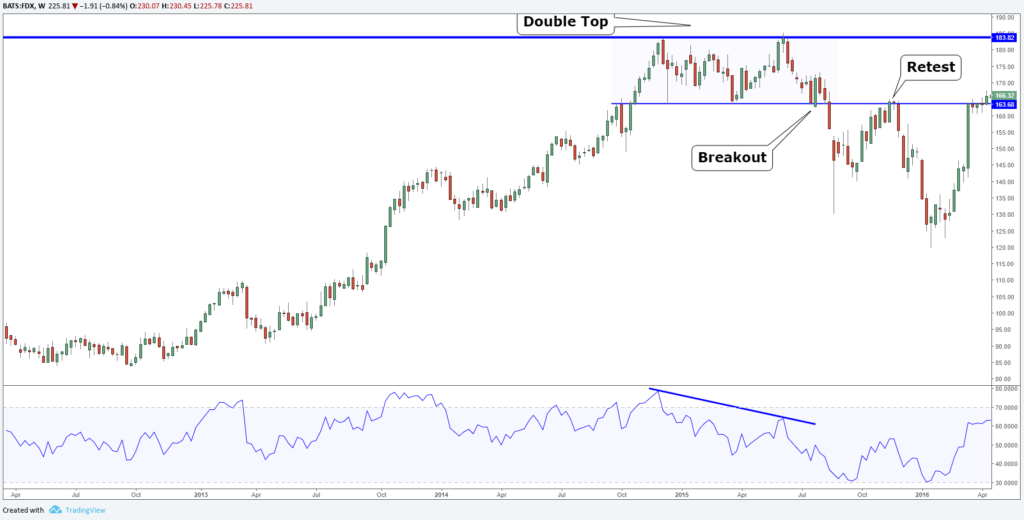
Daily Double Top w RSI
Using a combination of tools can help the trader in assessing how likely it is for the pattern to play out. As an example, in the FDX double top, adding a momentum indicator such as RSI reveals a divergence between momentum and price at the time of the double top.
Another tool that could have been used in the same example is a channel.
As can be seen in the below example, FDX broke lower from a rising channel prior to activating the double top pattern.
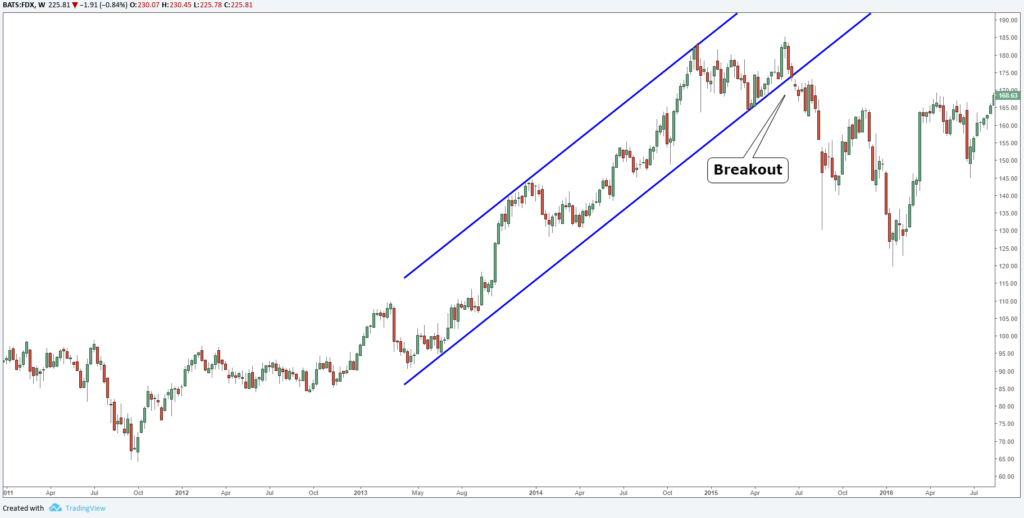
Combining tools provides a higher conviction of a turn as several technical indicators align and signal the same thing, increasing the probability of the expected move playing out.
Traders that take advantage of chart patterns tend to be patient, waiting for a nicely formed pattern to be presented and often utilize other technical tools to assess the likelihood of the pattern playing out.
The Smart Investor content is intended to be used and must be used for informational purposes only. We are not an investment advisor and you should NOT rely on this information to make investment decisions.
Opinions are on our own. The information is provided for information only and does not constitute, and should not be construed as, investment advice or a recommendation to buy, sell, or otherwise transact in any investment including any products or services or an invitation, offer or solicitation to engage in any investment activity.
Editors’ Picks

EUR/USD hits two-day highs near 1.1820
EUR/USD picks up pace and reaches two-day tops around 1.1820 at the end of the week. The pair’s move higher comes on the back of renewed weakness in the US Dollar amid growing talk that the Fed could deliver an interest rate cut as early as March. On the docket, the flash US Consumer Sentiment improves to 57.3 in February.

GBP/USD reclaims 1.3600 and above
GBP/USD reverses two straight days of losses, surpassing the key 1.3600 yardstick on Friday. Cable’s rebound comes as the Greenback slips away from two-week highs in response to some profit-taking mood and speculation of Fed rate cuts. In addition, hawkish comments from the BoE’s Pill are also collaborating with the quid’s improvement.

USD/JPY drops back below 157.00, as focus shifts to Japan snap election
USD/JPY is back in the red below 157.00 in the Asian session on Friday. The Japanese Yen recovers ground against the US Dollar amid some profit-taking ahead of Japan's snap general election on Sunday. The preliminary reading of the Michigan Consumer Sentiment Index report for February will be released later on Friday.
Editors’ Picks

EUR/USD: US Dollar to remain pressured until uncertainty fog dissipates Premium
The EUR/USD pair lost additional ground in the first week of February, settling at around 1.1820. The reversal lost momentum after the pair peaked at 1.2082 in January, its highest since mid-2021.

Gold: Volatility persists in commodity space Premium
After losing more than 8% to end the previous week, Gold (XAU/USD) remained under heavy selling pressure on Monday and dropped toward $4,400. Although XAU/USD staged a decisive rebound afterward, it failed to stabilize above $5,000.

GBP/USD: Pound Sterling tests key support ahead of a big week Premium
The Pound Sterling (GBP) changed course against the US Dollar (USD), with GBP/USD giving up nearly 200 pips in a dramatic correction.

Bitcoin: The worst may be behind us
Bitcoin (BTC) price recovers slightly, trading at $65,000 at the time of writing on Friday, after reaching a low of $60,000 during the early Asian trading session. The Crypto King remained under pressure so far this week, posting three consecutive weeks of losses exceeding 30%.

Three scenarios for Japanese Yen ahead of snap election Premium
The latest polls point to a dominant win for the ruling bloc at the upcoming Japanese snap election. The larger Sanae Takaichi’s mandate, the more investors fear faster implementation of tax cuts and spending plans.
RECOMMENDED LESSONS
Making money in forex is easy if you know how the bankers trade!
I’m often mystified in my educational forex articles why so many traders struggle to make consistent money out of forex trading. The answer has more to do with what they don’t know than what they do know. After working in investment banks for 20 years many of which were as a Chief trader its second knowledge how to extract cash out of the market.
5 Forex News Events You Need To Know
In the fast moving world of currency markets where huge moves can seemingly come from nowhere, it is extremely important for new traders to learn about the various economic indicators and forex news events and releases that shape the markets. Indeed, quickly getting a handle on which data to look out for, what it means, and how to trade it can see new traders quickly become far more profitable and sets up the road to long term success.
Top 10 Chart Patterns Every Trader Should Know
Chart patterns are one of the most effective trading tools for a trader. They are pure price-action, and form on the basis of underlying buying and selling pressure. Chart patterns have a proven track-record, and traders use them to identify continuation or reversal signals, to open positions and identify price targets.
7 Ways to Avoid Forex Scams
The forex industry is recently seeing more and more scams. Here are 7 ways to avoid losing your money in such scams: Forex scams are becoming frequent. Michael Greenberg reports on luxurious expenses, including a submarine bought from the money taken from forex traders. Here’s another report of a forex fraud. So, how can we avoid falling in such forex scams?
What Are the 10 Fatal Mistakes Traders Make
Trading is exciting. Trading is hard. Trading is extremely hard. Some say that it takes more than 10,000 hours to master. Others believe that trading is the way to quick riches. They might be both wrong. What is important to know that no matter how experienced you are, mistakes will be part of the trading process.
The challenge: Timing the market and trader psychology
Successful trading often comes down to timing – entering and exiting trades at the right moments. Yet timing the market is notoriously difficult, largely because human psychology can derail even the best plans. Two powerful emotions in particular – fear and greed – tend to drive trading decisions off course.