Don't worry about specifics like pips, ticks, cents, bps.
Instead, we'll refer to all of them as points. Okay?
Now, which is more likely:
-
You put on a trade aiming for 5 points and it works.
-
You put on a trade aiming for 30 points and it works.
-
You put on a trade aiming for 100 points and it works.
That would be 5 points. Right?
So why don't you make trades for only 5 points?
Answer: Because you find yourself having to risk more than 5 points or you always lose. Agree?
And whatever number of points you're risking, you need to make a fair bit more as a reward. Correct?
Now what do you know about how professionals trade? I'll tell you in a minute:
What was my first live trading (with real money) exercise when I traded at a professional firm?
Only risk 1 point to only make 1 point.
Sounds crazy. But here's why...
You see:
It wasn't an exercise in making money. If you made a point you had to get out of the market to keep practising entering a trade at precisely the right time to 'move onside' immediately.
What does it mean to move onside?
It means the price doesn't trade at a price worse than your entry.
Just imagine if every time you entered a trade, it always went in your favour immediately.
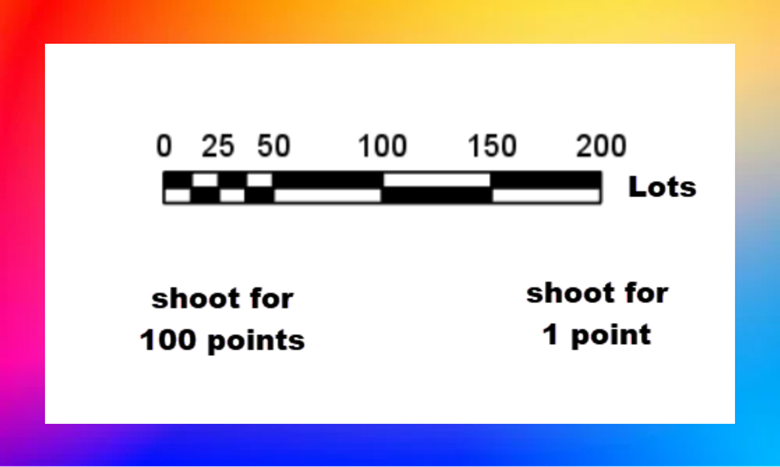
It means you can set yourself up for greater payouts without increasing your dollars risked. It means the market can move only slightly to pay you meaningfully. And because smaller moves working for you are much more likely, you get paid more often.
That's the gist of it. But in reality:
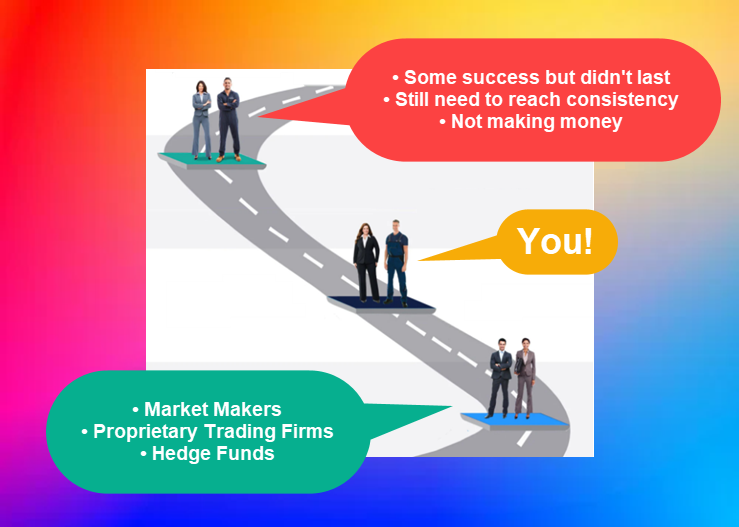
Most people operate close to the left, while consistently successful traders operate closer to the right.
Take tennis:
If you serve a fault and another - you don't give yourself a chance to make a point. Right?
But if you can get your serve in, at least you've got a chance.
And trading's the same. Move onside and you give yourself a chance.
What's a chance look like?
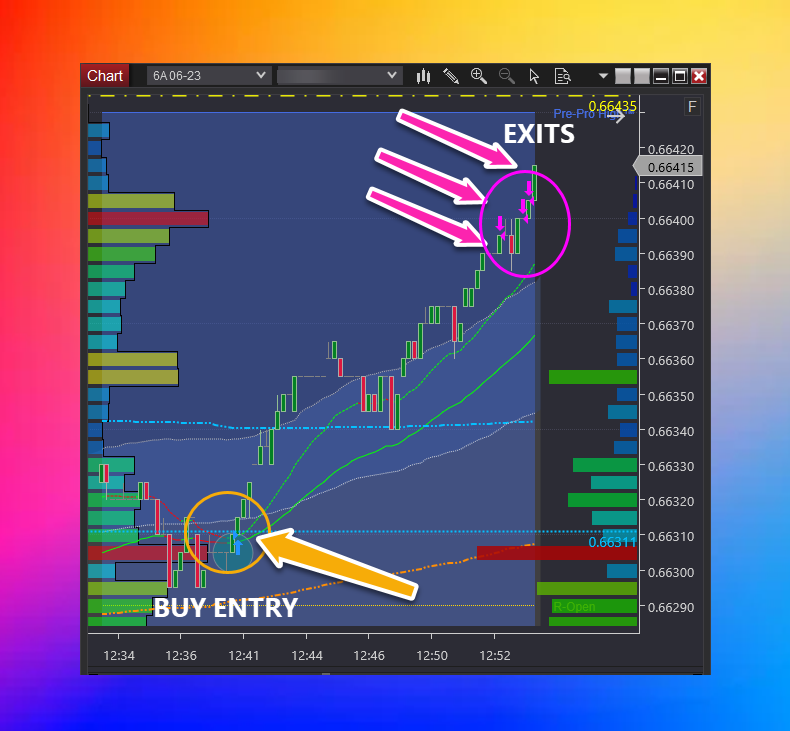
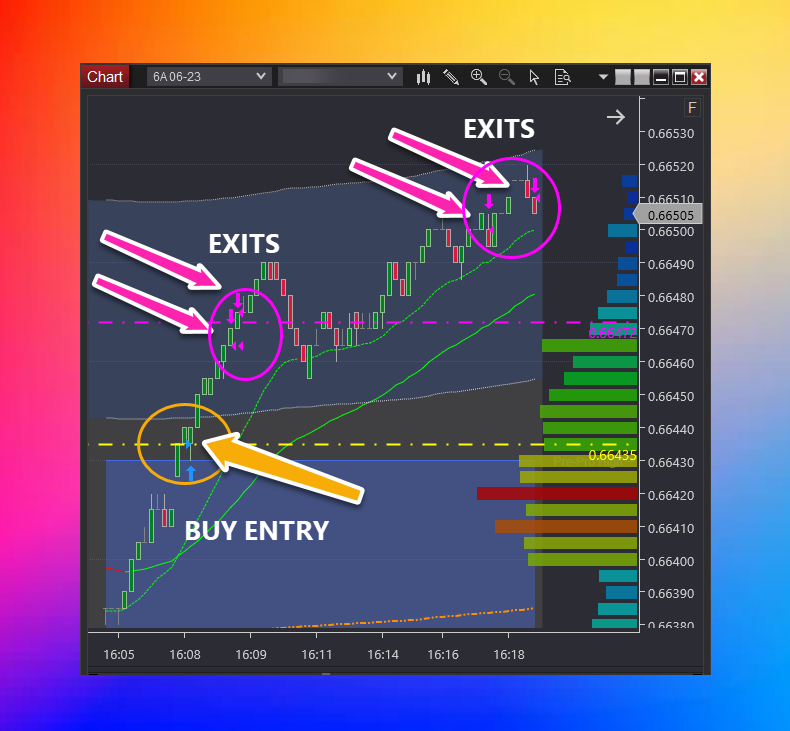
In each of the trades taken below, what you can you see?
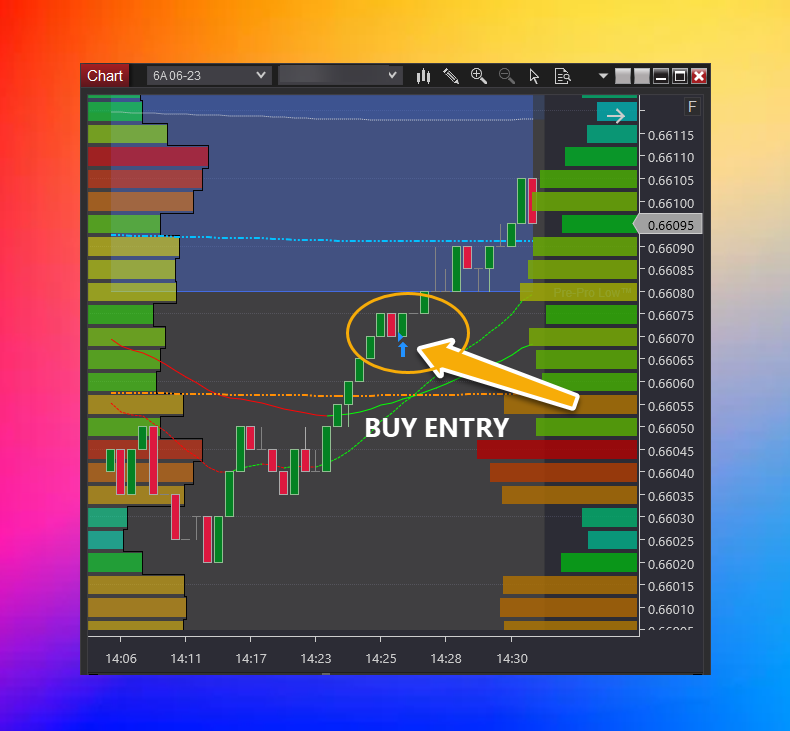
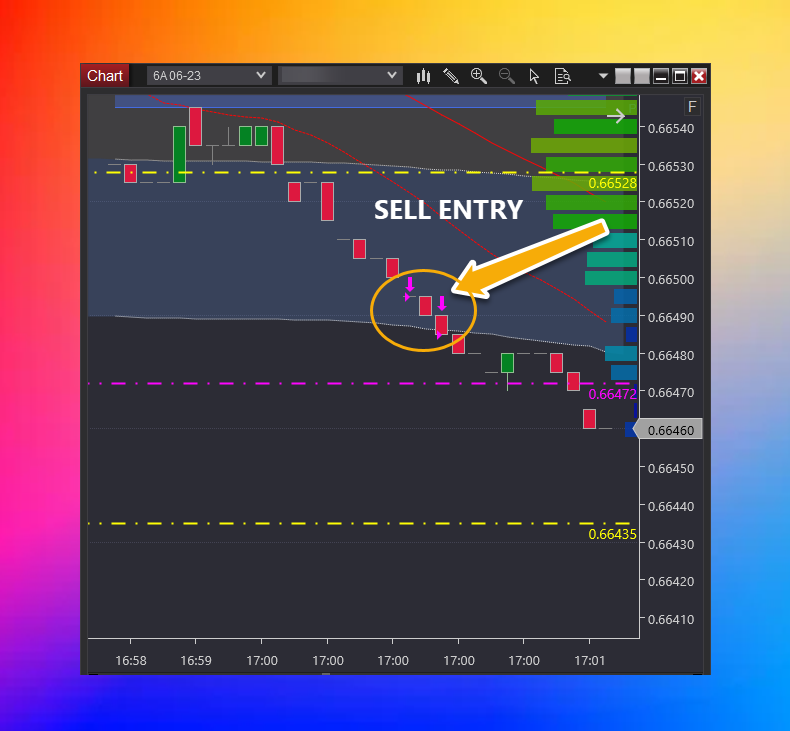
With each trade entry price immediately moved in favour. Each entry moved onside.
But guess what?
None of these trades ultimately worked! Each trade finished at about the same entry price. Not a loss. But not a win either.
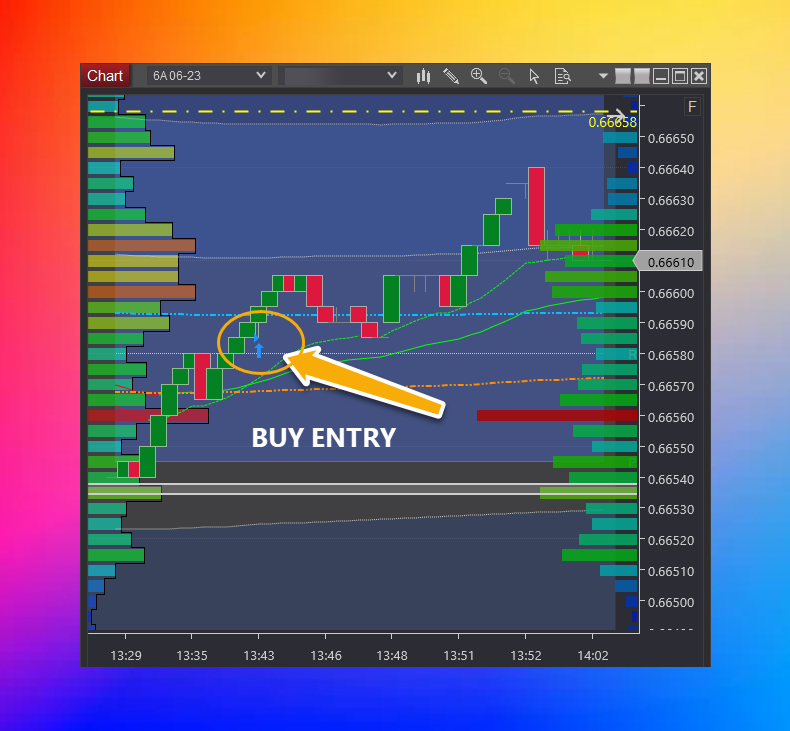
But because you're so good at moving onside:
You can optimise the size of your trades so that relatively smaller moves are lucrative. Because in addition to trades that don't win or lose, you'll also have trades like this:
And that's how professionals play the game.
How do they learn this? I'll tell you in a second. First:
Room for flex
Crafting a solid foundation for a towering skyscraper requires a delicate balance between unyielding concrete and steel while allowing for a slight flex for the earth's subtle movements. Correct.
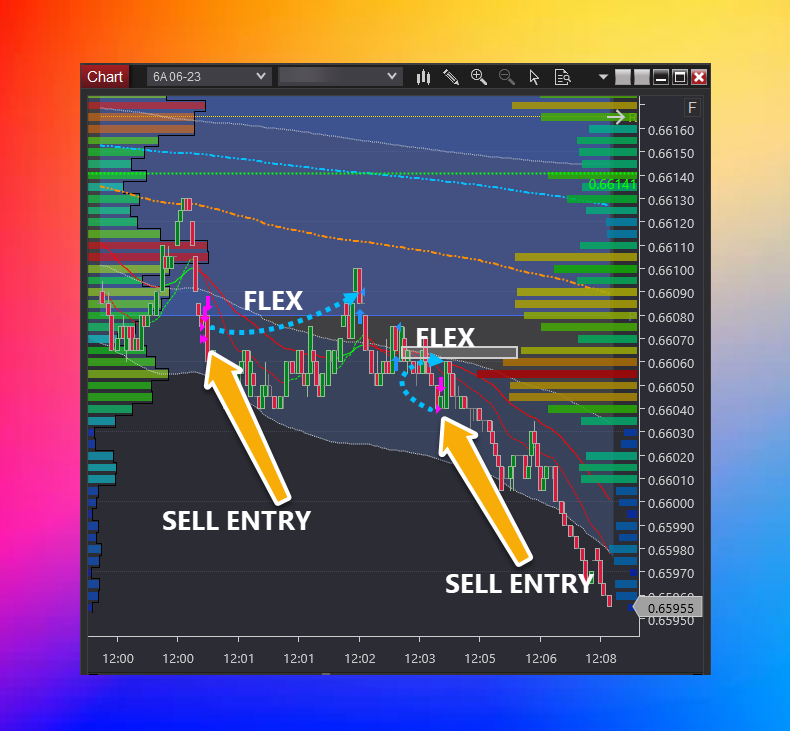
A slight flex is needed for trades too.
You aim to move onside immediately - and you often can. But remember the part of the exercise that said 'only lose 1 point'? The emphasis is slight. Like the trades below:
- The first flex ends in a minor loss.
- The second flex ends lucratively.
Professionals and precision: How's it done?
Despite using charts above for visual aids, professionals don't derive the decisions to enter and exit from charts.
At a high level it entails:
- Knowing the game and the role of relative value
- Knowing how to spot those who move markets
- Knowing how to spot those who mostly lose
- Knowing how those who move markets entice those who continually lose into their losing trades
This positions you between both groups as shown. Make sense?
And at a granular level it comes down to:
- Daily playing field (the boundaries of price)
- Daily game plan
- Playbook trades
- Tape reading
Etc
That's all for now.
Further reading:
A potent cocktail of concepts that propel traders from slump to success [Video]
Forex and derivatives trading is a highly competitive and often extremely fast-paced environment. It only rewards individuals who attain the required level of skill and expertise to compete. Past performance is not indicative of future results. There is a substantial risk of loss to unskilled and inexperienced players. The high degree of leverage can work against you as well as for you. Before deciding to trade any such leveraged products you should carefully consider your investment objectives, level of experience, and risk appetite. The possibility exists that you could sustain a loss of some or all of your initial investment and therefore you should not invest money that you cannot afford to lose. You should be aware of all the risks associated with trading on margin, and seek advice from an independent
Editors’ Picks

EUR/USD tests nine-day EMA support near 1.1850
EUR/USD inches lower during the Asian hours on Monday, trading around 1.1870 at the time of writing. The 14-day Relative Strength Index momentum indicator at 56 stays above the midline, confirming improving momentum. RSI has cooled from prior overbought readings but stabilizes above 50, suggesting dips could stay limited before buyers reassert control.

GBP/USD flat lines as traders await key UK macro data and FOMC minutes
The GBP/USD pair kicks off a new week on a subdued note and oscillates in a narrow range, just below mid-1.3600s, during the Asian session. Moreover, the mixed fundamental backdrop warrants some caution for aggressive traders as the market focus now shifts to this week's important releases from the UK and the US.

USD/JPY stays firm around 153.00 after Japan's Q4 GDP miss
USD/JPY kicks off the new week on a positive note as Japan's weak Q4 GDP growth tempers bets for an immediate BoJ rate hike and undermines the Japanese Yen. Investors, however, seem convinced that the BoJ will stick to its policy normalization path amid hopes that PM Takaichi's policies will boost the Japanese economy. In contrast, cooling US consumer inflation reaffirmed bets for more Fed rate cuts in 2026, which acts as a headwind for the US Dollar and should cap the currency pair.
Editors’ Picks
EUR/USD tests nine-day EMA support near 1.1850
EUR/USD inches lower during the Asian hours on Monday, trading around 1.1870 at the time of writing. The 14-day Relative Strength Index momentum indicator at 56 stays above the midline, confirming improving momentum. RSI has cooled from prior overbought readings but stabilizes above 50, suggesting dips could stay limited before buyers reassert control.
GBP/USD flat lines as traders await key UK macro data and FOMC minutes
The GBP/USD pair kicks off a new week on a subdued note and oscillates in a narrow range, just below mid-1.3600s, during the Asian session. Moreover, the mixed fundamental backdrop warrants some caution for aggressive traders as the market focus now shifts to this week's important releases from the UK and the US.

Gold slides below $5,000 amid USD uptick and positive risk tone; downside seems limited
Gold attracts fresh sellers at the start of a new week and reverses a part of Friday's strong move up of over $150 from sub-$4,900 levels. The commodity slides back below the $5,000 psychological mark during the Asian session, though the downside potential seems limited amid a combination of supporting factors.

Bitcoin, Ethereum and Ripple consolidate within key ranges as selling pressure eases
Bitcoin and Ethereum prices have been trading sideways within key ranges following the massive correction. Meanwhile, XRP recovers slightly, breaking above the key resistance zone. The top three cryptocurrencies hint at a potential short-term recovery, with momentum indicators showing fading bearish signs.
Global inflation watch: Signs of cooling services inflation
Realized inflation landed close to expectations in January, as negative base effects weighed on the annual rates. Remaining sticky inflation is largely explained by services, while tariff-driven goods inflation remains limited even in the US.
RECOMMENDED LESSONS
Making money in forex is easy if you know how the bankers trade!
I’m often mystified in my educational forex articles why so many traders struggle to make consistent money out of forex trading. The answer has more to do with what they don’t know than what they do know. After working in investment banks for 20 years many of which were as a Chief trader its second knowledge how to extract cash out of the market.
5 Forex News Events You Need To Know
In the fast moving world of currency markets where huge moves can seemingly come from nowhere, it is extremely important for new traders to learn about the various economic indicators and forex news events and releases that shape the markets. Indeed, quickly getting a handle on which data to look out for, what it means, and how to trade it can see new traders quickly become far more profitable and sets up the road to long term success.
Top 10 Chart Patterns Every Trader Should Know
Chart patterns are one of the most effective trading tools for a trader. They are pure price-action, and form on the basis of underlying buying and selling pressure. Chart patterns have a proven track-record, and traders use them to identify continuation or reversal signals, to open positions and identify price targets.
7 Ways to Avoid Forex Scams
The forex industry is recently seeing more and more scams. Here are 7 ways to avoid losing your money in such scams: Forex scams are becoming frequent. Michael Greenberg reports on luxurious expenses, including a submarine bought from the money taken from forex traders. Here’s another report of a forex fraud. So, how can we avoid falling in such forex scams?
What Are the 10 Fatal Mistakes Traders Make
Trading is exciting. Trading is hard. Trading is extremely hard. Some say that it takes more than 10,000 hours to master. Others believe that trading is the way to quick riches. They might be both wrong. What is important to know that no matter how experienced you are, mistakes will be part of the trading process.
The challenge: Timing the market and trader psychology
Successful trading often comes down to timing – entering and exiting trades at the right moments. Yet timing the market is notoriously difficult, largely because human psychology can derail even the best plans. Two powerful emotions in particular – fear and greed – tend to drive trading decisions off course.