![]() Lorenzo Stroe
Lorenzo Stroe
Independent Analyst
- Zilliqa price is trading between a symmetrical triangle pattern on the 12-hour chart.
- The digital asset is barely holding a crucial support level at $0.066 which could lead to a massive fall.
Zilliqa had a massive run to $0.099 that ended on December 27, 2020. The digital asset has been under consolidation since then and it’s now on the verge of plummeting if a crucial support level is not defended by the bulls.
Zilliqa price could dive towards $0.032 if bulls can’t defend this level
On the 12-hour chart, Zilliqa has formed a symmetrical triangle pattern which seems to be on the verge of bursting in favor of the bears. A breakdown below the critical support level at $0.066 would lead Zilliqa price towards a low of $0.032, a 50% move.
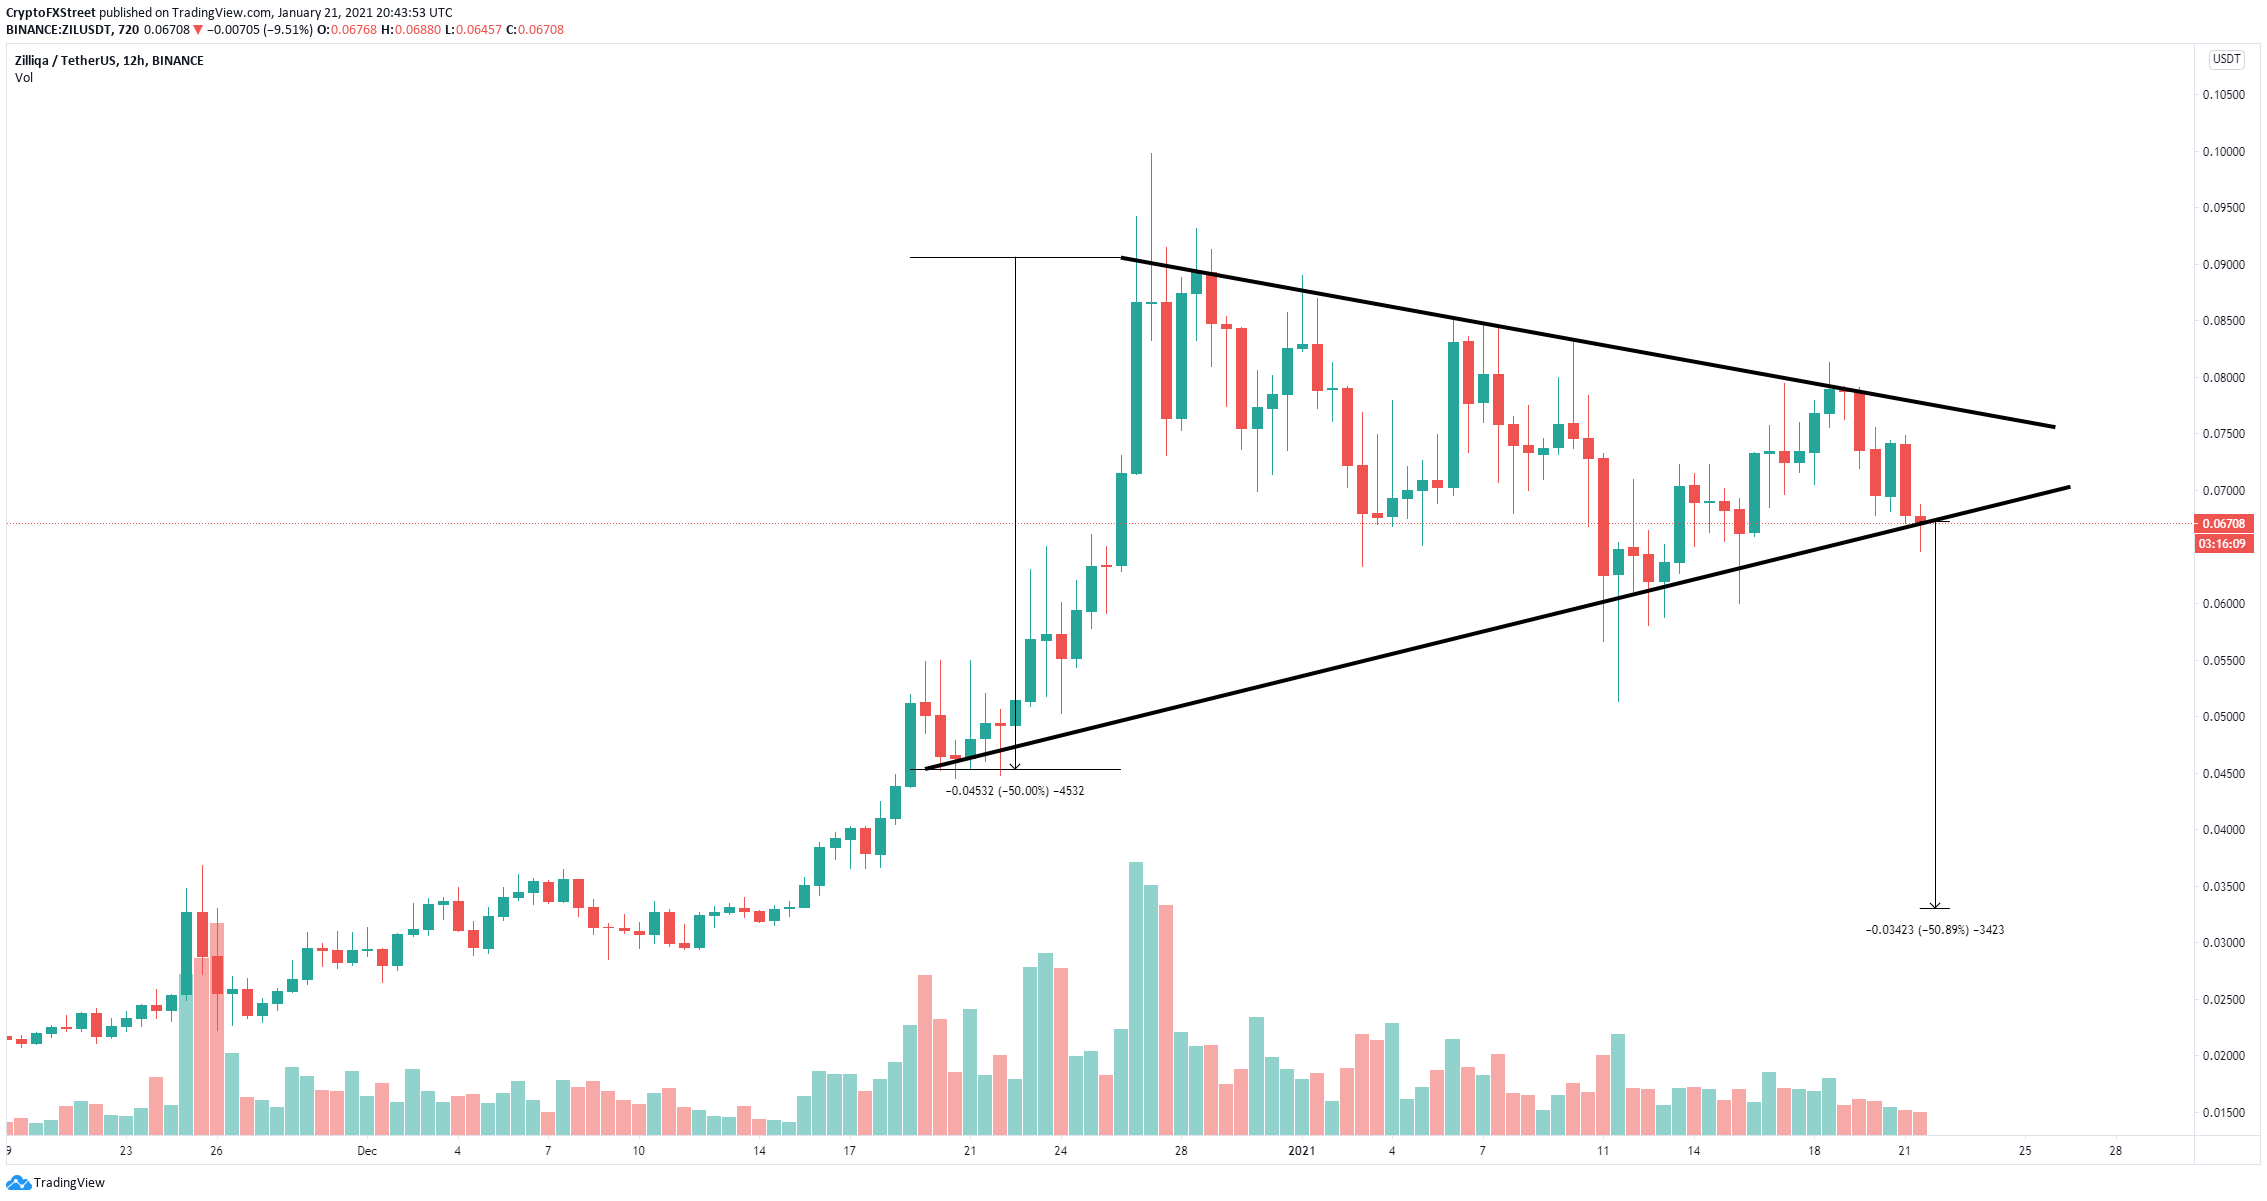
ZIL/USD 12-hour chart
There is some hope for Zilliqa as the TD Sequential indicator is prepared to present a buy signal on the 2-hour chart which should help the bulls defend the crucial support level of $0.066, at least in the short-term.
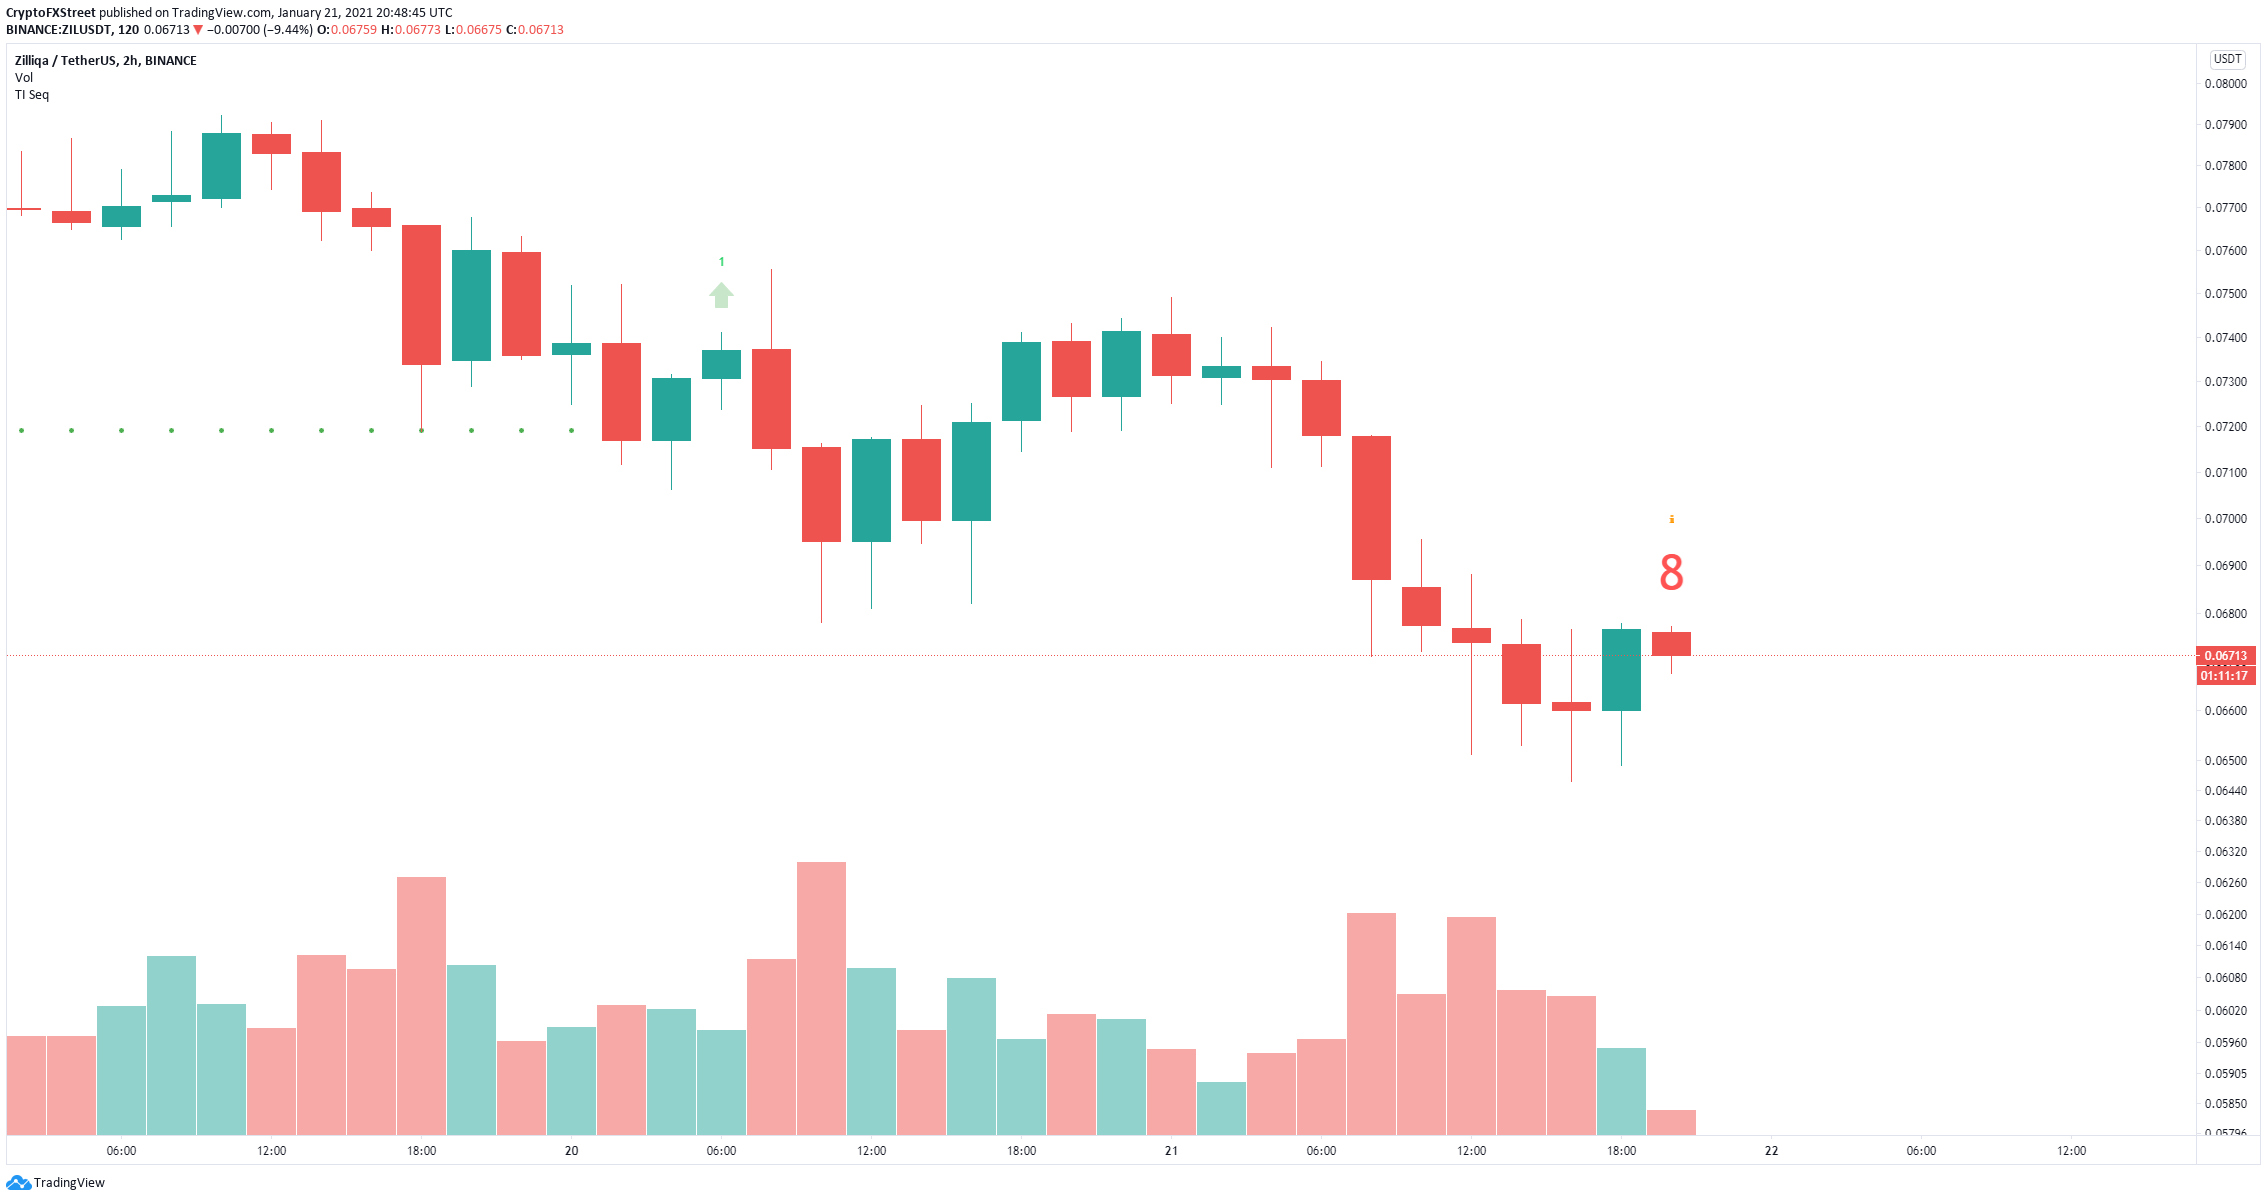
ZIL/USD 2-hour chart
Successfully defending it could drive Zilliqa price towards the upper trendline of the pattern at $0.076. A breakout of this point would yield similar results pushing the digital asset by up to 50% in the long-term.
Note: All information on this page is subject to change. The use of this website constitutes acceptance of our user agreement. Please read our privacy policy and legal disclaimer. Opinions expressed at FXstreet.com are those of the individual authors and do not necessarily represent the opinion of FXstreet.com or its management. Risk Disclosure: Trading foreign exchange on margin carries a high level of risk, and may not be suitable for all investors. The high degree of leverage can work against you as well as for you. Before deciding to invest in foreign exchange you should carefully consider your investment objectives, level of experience, and risk appetite. The possibility exists that you could sustain a loss of some or all of your initial investment and therefore you should not invest money that you cannot afford to lose. You should be aware of all the risks associated with foreign exchange trading, and seek advice from an independent financial advisor if you have any doubts.
Recommended Content
Editors’ Picks

Litecoin Price Prediction: LTC tries to retake $100 resistance as miners halt sell-off
Litecoin price grazed 105 mark on Monday, rebounding 22% from the one-month low of $87 recorded during last week’s market crash. On-chain data shows sell pressure among LTC miners has subsided. Is the bottom in?

Bitcoin fails to recover as Metaplanet buys the dip
Bitcoin price struggles around $95,000 after erasing gains from Friday’s relief rally over the weekend. Bitcoin’s weekly price chart posts the first major decline since President-elect Donald Trump’s win in November.

SEC Commissioner Hester Pierce sheds light on Ethereum ETF staking under new administration
In a Friday interview with Coinage, SEC Commissioner Hester Peirce discussed her optimism about upcoming regulatory changes as the agency transitions to new leadership under President Trump’s pick for new Chair, Paul Atkins.

Bitcoin dives 3% from its recent all-time high, is this the cycle top?
Bitcoin investors panicked after the Fed's hawkish rate cut decision, hitting the market with high selling pressure. Bitcoin's four-year market cycle pattern indicates that the recent correction could be temporary.
Bitcoin: 2025 outlook brightens on expectations of US pro-crypto policy
Bitcoin price has surged more than 140% in 2024, reaching the $100K milestone in early December. The rally was driven by the launch of Bitcoin Spot ETFs in January and the reduced supply following the fourth halving event in April.

Best Forex Brokers with Low Spreads
VERIFIED Low spreads are crucial for reducing trading costs. Explore top Forex brokers offering competitive spreads and high leverage. Compare options for EUR/USD, GBP/USD, USD/JPY, and Gold.