![]() Sheldon McIntyre, CMT
Sheldon McIntyre, CMT
Independent Analyst
- Zilliqa price is releasing from a bear flag pattern on the weekly chart, implying a substantial decline.
- The March 2020 rising trend line has been reliable support on a weekly closing basis.
- ZIL 10-week simple moving average (SMA) is trending downward, creating a headwind for future price strength.
Zilliqa price rests below the 200-day SMA and near the March 2020 rising trend line. The breakdown from a bear flag continuation pattern focuses on the 23.6% Fibonacci retracement level, the 50-week SMA and the May low. A failure to hold the May low may unleash a considerable ZIL decline.
Zilliqa price chart discloses some encouraging support
Zilliqa price declined over 70% from the all-time high of $0.262 to the May 23 low of $0.069. The remarkable drop followed multiple frustrating attempts to overcome the 2018 high of $0.235, resulting in a double top that loudly triggered on May 19 with a drop below $0.115.
Zilliqa price identified support at the 50-week SMA before rebounding back above the March 2020 rising trend line and the 23.6% retracement level at $0.085 by the end of the week.
Over the last two weeks, Zilliqa price wedged higher, forming a bear flag pattern that triggered this week with a decline below $0.116. ZIL has since recognized support near the 23.6% retracement but still hovers below the March 2020 rising trend line currently at $0.100.
The bear flag continuation pattern’s measured move is roughly 65%, potentially pushing Zilliqa price down to $0.040. It would be a headline-worthy plunge, frustrating believers in the decentralized application-focused blockchain platform. At completion, ZIL would be trading below the 38.2% retracement of the 2020-2021 advance at $0.042 and just above the neckline of the 2018-2020 inverse head-and-shoulders pattern.
Without a weekly close below the March 2020 trend line at $0.100, Zilliqa price will be exposed to further oscillations around the 200-day SMA at $0.120, preserving an erratic period for ZIL market operators.
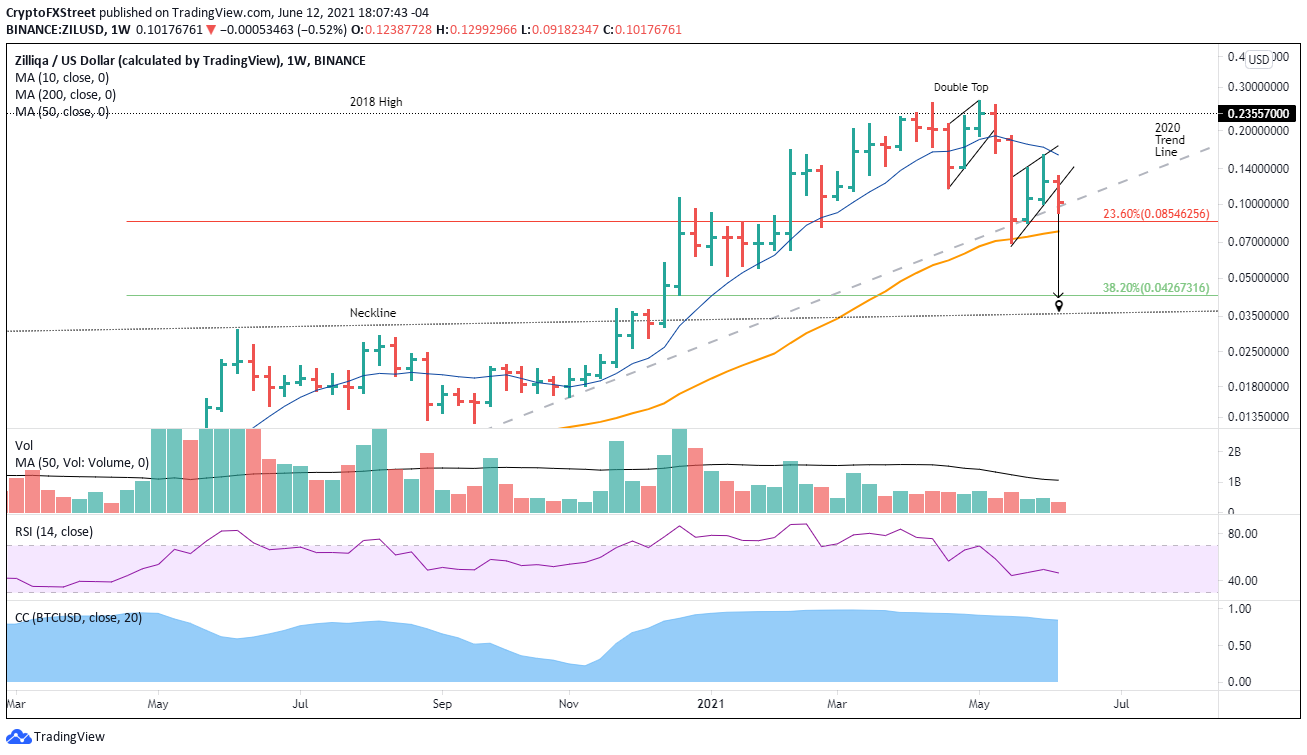
ZIL/USD weekly chart
To void the bleak outlook presented by Zilliqa price, ZIL would need a 20%+ gain from the current price and a weekly close above the flag’s lower trend line at approximately $0.119.
The Zilliqa price chart, like other altcoin charts, is illustrating a bearish outlook. However, with the precise, persuasive levels of support and resistance outlined above, ZIL investors are equipped to avoid the panic and financial devastation that would accompany a 65% decline.
Note: All information on this page is subject to change. The use of this website constitutes acceptance of our user agreement. Please read our privacy policy and legal disclaimer. Opinions expressed at FXstreet.com are those of the individual authors and do not necessarily represent the opinion of FXstreet.com or its management. Risk Disclosure: Trading foreign exchange on margin carries a high level of risk, and may not be suitable for all investors. The high degree of leverage can work against you as well as for you. Before deciding to invest in foreign exchange you should carefully consider your investment objectives, level of experience, and risk appetite. The possibility exists that you could sustain a loss of some or all of your initial investment and therefore you should not invest money that you cannot afford to lose. You should be aware of all the risks associated with foreign exchange trading, and seek advice from an independent financial advisor if you have any doubts.
Recommended Content
Editors’ Picks

Ethereum Price Forecast: ETH plunges 6% following Fed rate decision, eyes a bounce at the $3,550 level
Ethereum is down 6% after the Federal Reserve hinted that it will reduce its rate cut frequency in 2025. The hawkish news has sent ETH's Weighted Sentiment to lows last seen in December 2023.

Crypto Today: Bitcoin holds $104K as XRP, AVAX and Solana traders take profits
The cryptocurrency sector valuation declined 4% on Wednesday, dropping toward $3.8 trillion. While Bitcoin price dipped 2% to consolidate around the $104,600 mark, top altcoins like XRP, AVAX and SOL suffered excess of 5% losses on the day.

Bitcoin, crypto market set for massive dump following Trump's inauguration: Arthur Hayes
Bitcoin and the crypto market could face a massive sell-off as expectations for Donald Trump's administration of pro-crypto policies could be short-lived, according to Arthur Hayes.

Shiba Inu Price Prediction: SHIB whale demand plunges as Solana memes dominate
Shiba Inu price opened trading at $0.000026 on Wednesday, its lowest opening price in 20 days dating back to November 29. On-chain data shows SHIB token struggling to attract whale demand as Solana memes dominate social channels.

Bitcoin: BTC reclaims $100K mark
Bitcoin briefly dipped below $94,000 earlier this week but recovered strongly, stabilizing around the $100,000 mark by Friday. Despite these mixed sentiments this week, institutional demand remained strong, adding $1.72 billion until Thursday.

Best Forex Brokers with Low Spreads
VERIFIED Low spreads are crucial for reducing trading costs. Explore top Forex brokers offering competitive spreads and high leverage. Compare options for EUR/USD, GBP/USD, USD/JPY, and Gold.