Zilliqa price poised for a surge following break above falling wedge pattern
- Zilliqa price broke above the falling wedge pattern, signaling a bullish price action ahead.
- On-chain data shows that ZIL's open interest is rising, and long-to-short ratio is above one, suggesting a bullish move.
- A daily candlestick close below $0.0123 would invalidate the bullish thesis.

Zilliqa (ZIL) price broke above the falling wedge pattern on Monday and rose 4.6% in the next two days. At the time of writing, it trades slightly down 0.5% on Wednesday. On-chain data shows that ZIL's Open Interest (OI) is rising, and long-to-short ratio is above one, suggesting a bullish move for Zilliqa in the upcoming days.
Zilliqa price shows potential for a rally ahead
Zilliqa price broke above the falling wedge pattern formed by connecting multiple high and low levels with a trendline from mid-March on Monday and rose 4.6% in the next two days.
On Wednesday, it faces resistance around the 50% retracement level (drawn from the high on July 22 to the low on August 5) at $0.0145 and trades slightly below by 0.5% at $0.0142.
If ZIL closes above the $0.0145 level, it could rally 20% to retest its July 29 high of $0.0175.
The Relative Strength Index (RSI) and the Awesome Oscillator (AO) on the daily chart are about to flip over their neutral levels of 50 and zero, respectively. Both indicators must trade above their neutral levels for bullish momentum to be sustained.
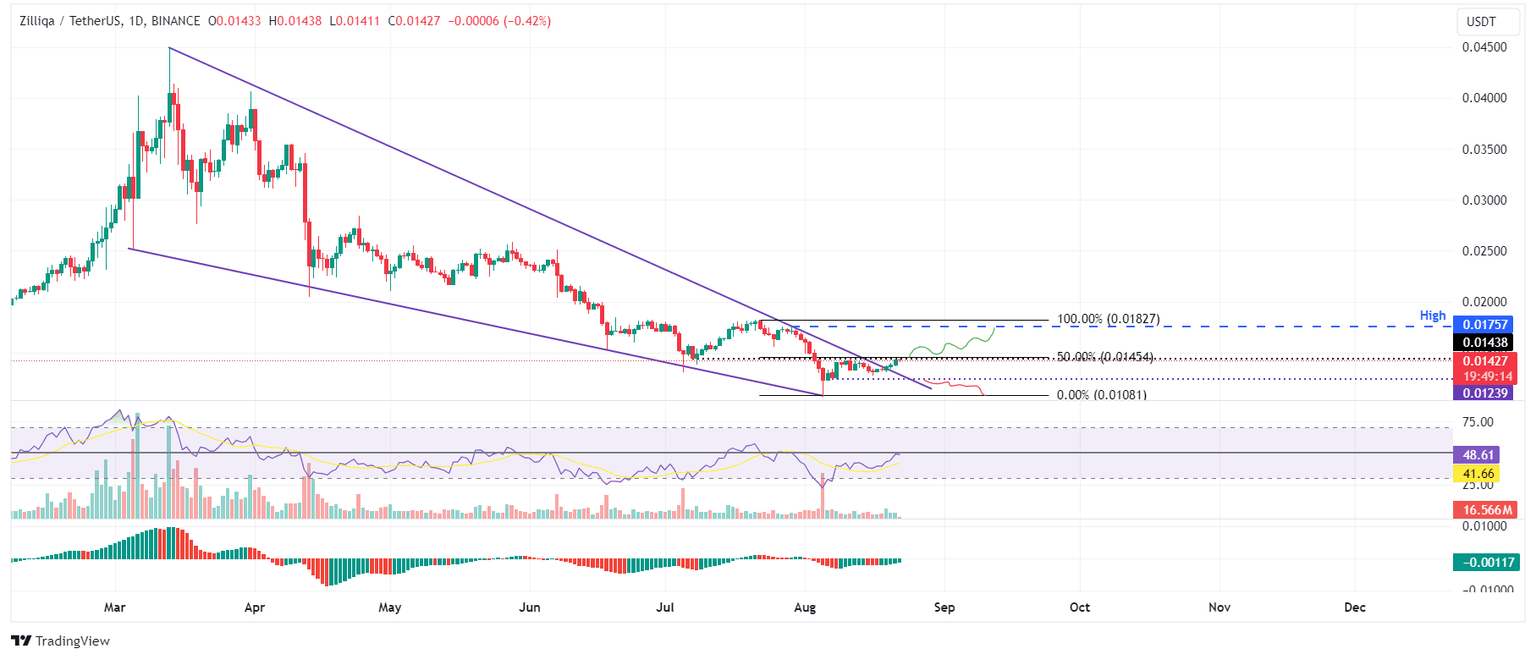
ZIL/USDT daily chart
Data from CoinGlass shows that the futures' OI in Zilliqa at exchanges is also increasing. The OI indicates the total number of outstanding derivative contracts that have not been settled (offset by delivery) and whether money flows into the contract are increasing or decreasing.
Increasing OI represents new or additional money entering the market and new buying, which suggests a bullish trend. When OI decreases, it is usually a sign that the market is liquidating, more investors are leaving, and the current price trend is ending.
The graph below shows that ZIL's OI increased from $8.27 million on Monday to $9.67 million on Thursday, indicating that new or additional money is entering the market and new buying is occurring.

ZIL Open Interest chart
Additionally, according to Coinglass's data, ZIL's long-to-short ratio is 1.12. This ratio reflects bullish sentiment in the market, as the number above one suggests that more trades anticipate the price of the asset to rise, bolstering Zilliqa's bullish outlook.
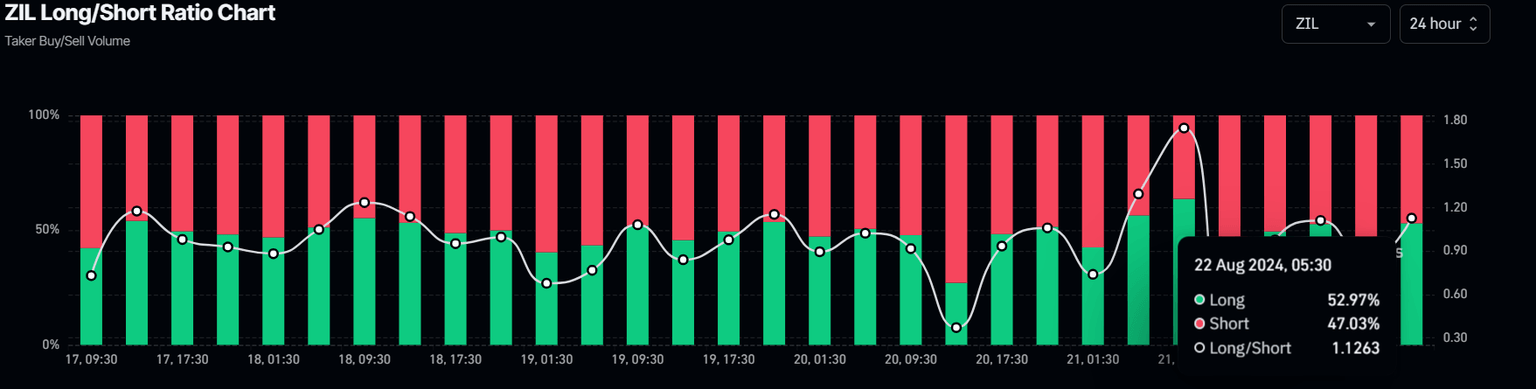
ZIL long-to-short ratio chart
Despite the bullish thesis signaled by both on-chain data and technical analysis, the outlook will shift to bearish if ZIL's daily candlestick closes below the $0.0123 August 7 low. This scenario could lead to a 12% crash to retest its August 5 low of $0.0108.
Author

Manish Chhetri
FXStreet
Manish Chhetri is a crypto specialist with over four years of experience in the cryptocurrency industry.


