Zilliqa price poised for a rally on positive on-chain data; bullish technical indicators
- Zilliqa price breaks above a falling wedge pattern, signaling a bullish move ahead.
- Everstake validators show that ZIL transactions have reached new highs, and staked tokens have surged 13.7 million.
- RSI and AO indicators form bullish divergences, signaling a bullish reversal.
- A daily candlestick close below $0.0151 would invalidate the bullish thesis.

Zilliqa (ZIL) price has broken above a falling wedge pattern, indicating a shift in market structure from bearish to bullish. Bullish divergence on the Relative Strength Index (RSI) and the Awesome Oscillator (AO) indicators signal a potential reversal and upward movement in ZIL price in the coming days.
Furthermore, renowned validators Everstake announced on social media platform X on Thursday that Zilliqa has reached a milestone with 67 million transactions. Additionally, the total amount of staked ZIL tokens has surged by 13.7 million, showcasing increasing investor confidence and commitment to utilizing the Zilliqa blockchain, hinting at a potential bullish trend ahead.
New heights achieved! 67 million transactions on @zilliqa!
— Everstake (@everstake_pool) July 16, 2024
In addition, the total number of staked ZIL has surged by an impressive 13.7M, demonstrating the growing confidence and commitment of #ZilFam.
Learn more about $ZIL staking here: https://t.co/96ihRYvCXL. pic.twitter.com/lCJ4kzCLPp
Zilliqa price shows potential for a bullish move
Zilliqa price broke above a falling wedge pattern on Monday and rose slightly higher by around 1.7% the next day. This pattern was formed by joining multiple swing high and low levels with trendlines from early March to mid-July. At the time of writing on Friday, ZIL trades around $0.0173, up by 1% in the day.
Additionally, the formation of a lower low on the daily chart on July 5 contrasts with the Relative Strength Index (RSI) indicator's higher high during the same period. This development is termed a bullish divergence and often leads to the reversal of the trend or a short-term rally.
If ZIL closes above the daily resistance at $0.0182, it could rally 15% to retest its next daily resistance at $0.0212.
Furthermore, if the bulls are aggressive, the overall crypto market outlook is positive, and ZIL closes above $0.0212. It could extend an additional rally of 18% to retest its weekly resistance at $0.0251.
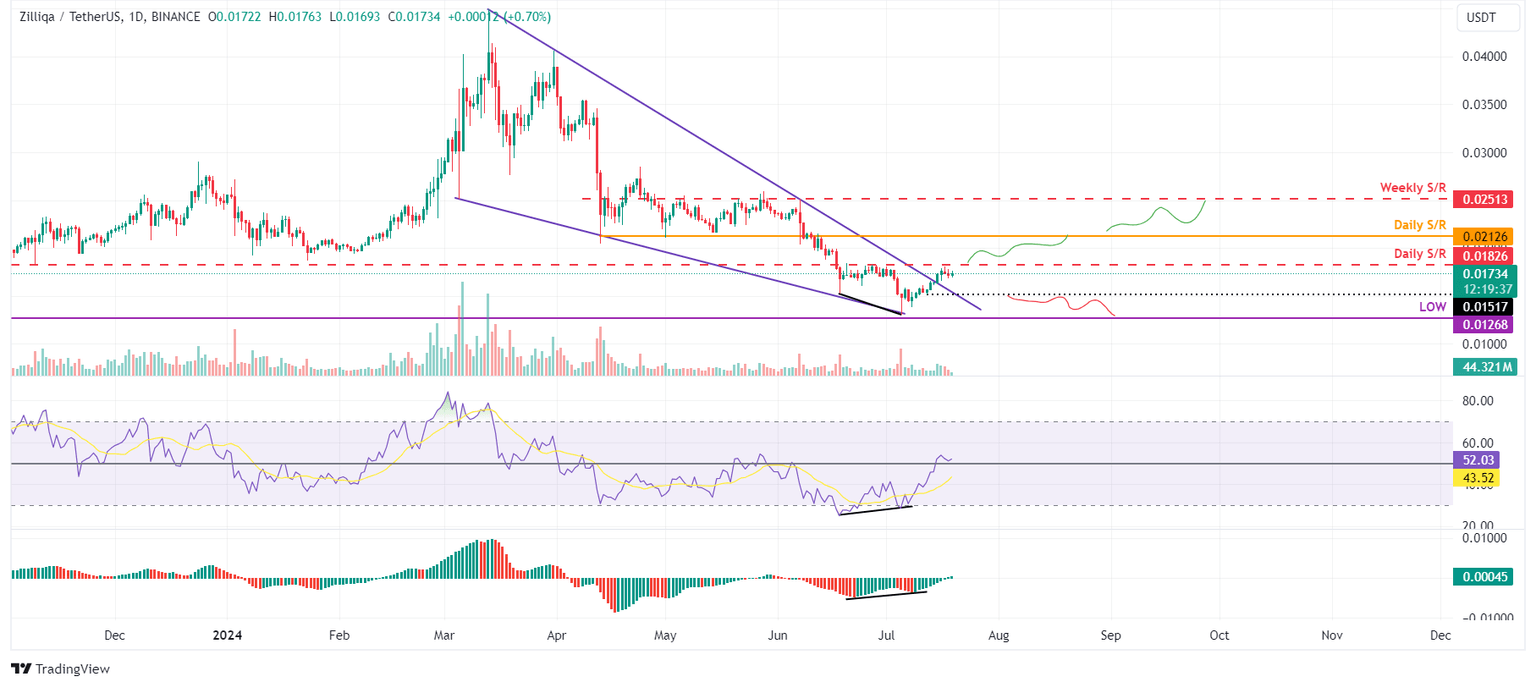
ZIL/USDT daily chart
However, if ZIL's daily candlestick closes below $0.0151 and establishes a lower low on the daily timeframe, it may signal a shift in market dynamics that favors bearish sentiment. Such a change could nullify the bullish outlook, leading to a 16% crash in Zilliqa's price to retest the September 21, 2020 low at $0.0126.
Author

Manish Chhetri
FXStreet
Manish Chhetri is a crypto specialist with over four years of experience in the cryptocurrency industry.


