- Zilliqa price could be on the verge of a pullback towards $0.051.
- A significant indicator has presented a sell signal in the short-term for ZIL.
Zilliqa has been trading inside a robust uptrend on basically all time frames, but it might need to see a short-term correction before resuming the uptrend. The digital asset is one of the few that remains positive in the past 24 hours, while the market enters a consolidation period.
Zilliqa price might need to drop towards $0.051
On the 4-hour chart, the TD Sequential indicator has just presented a sell signal for the first time since December 19 which turned out to be quite accurate. If the call is confirmed, Zilliqa price could dive towards the 26-EMA support level at $0.051.
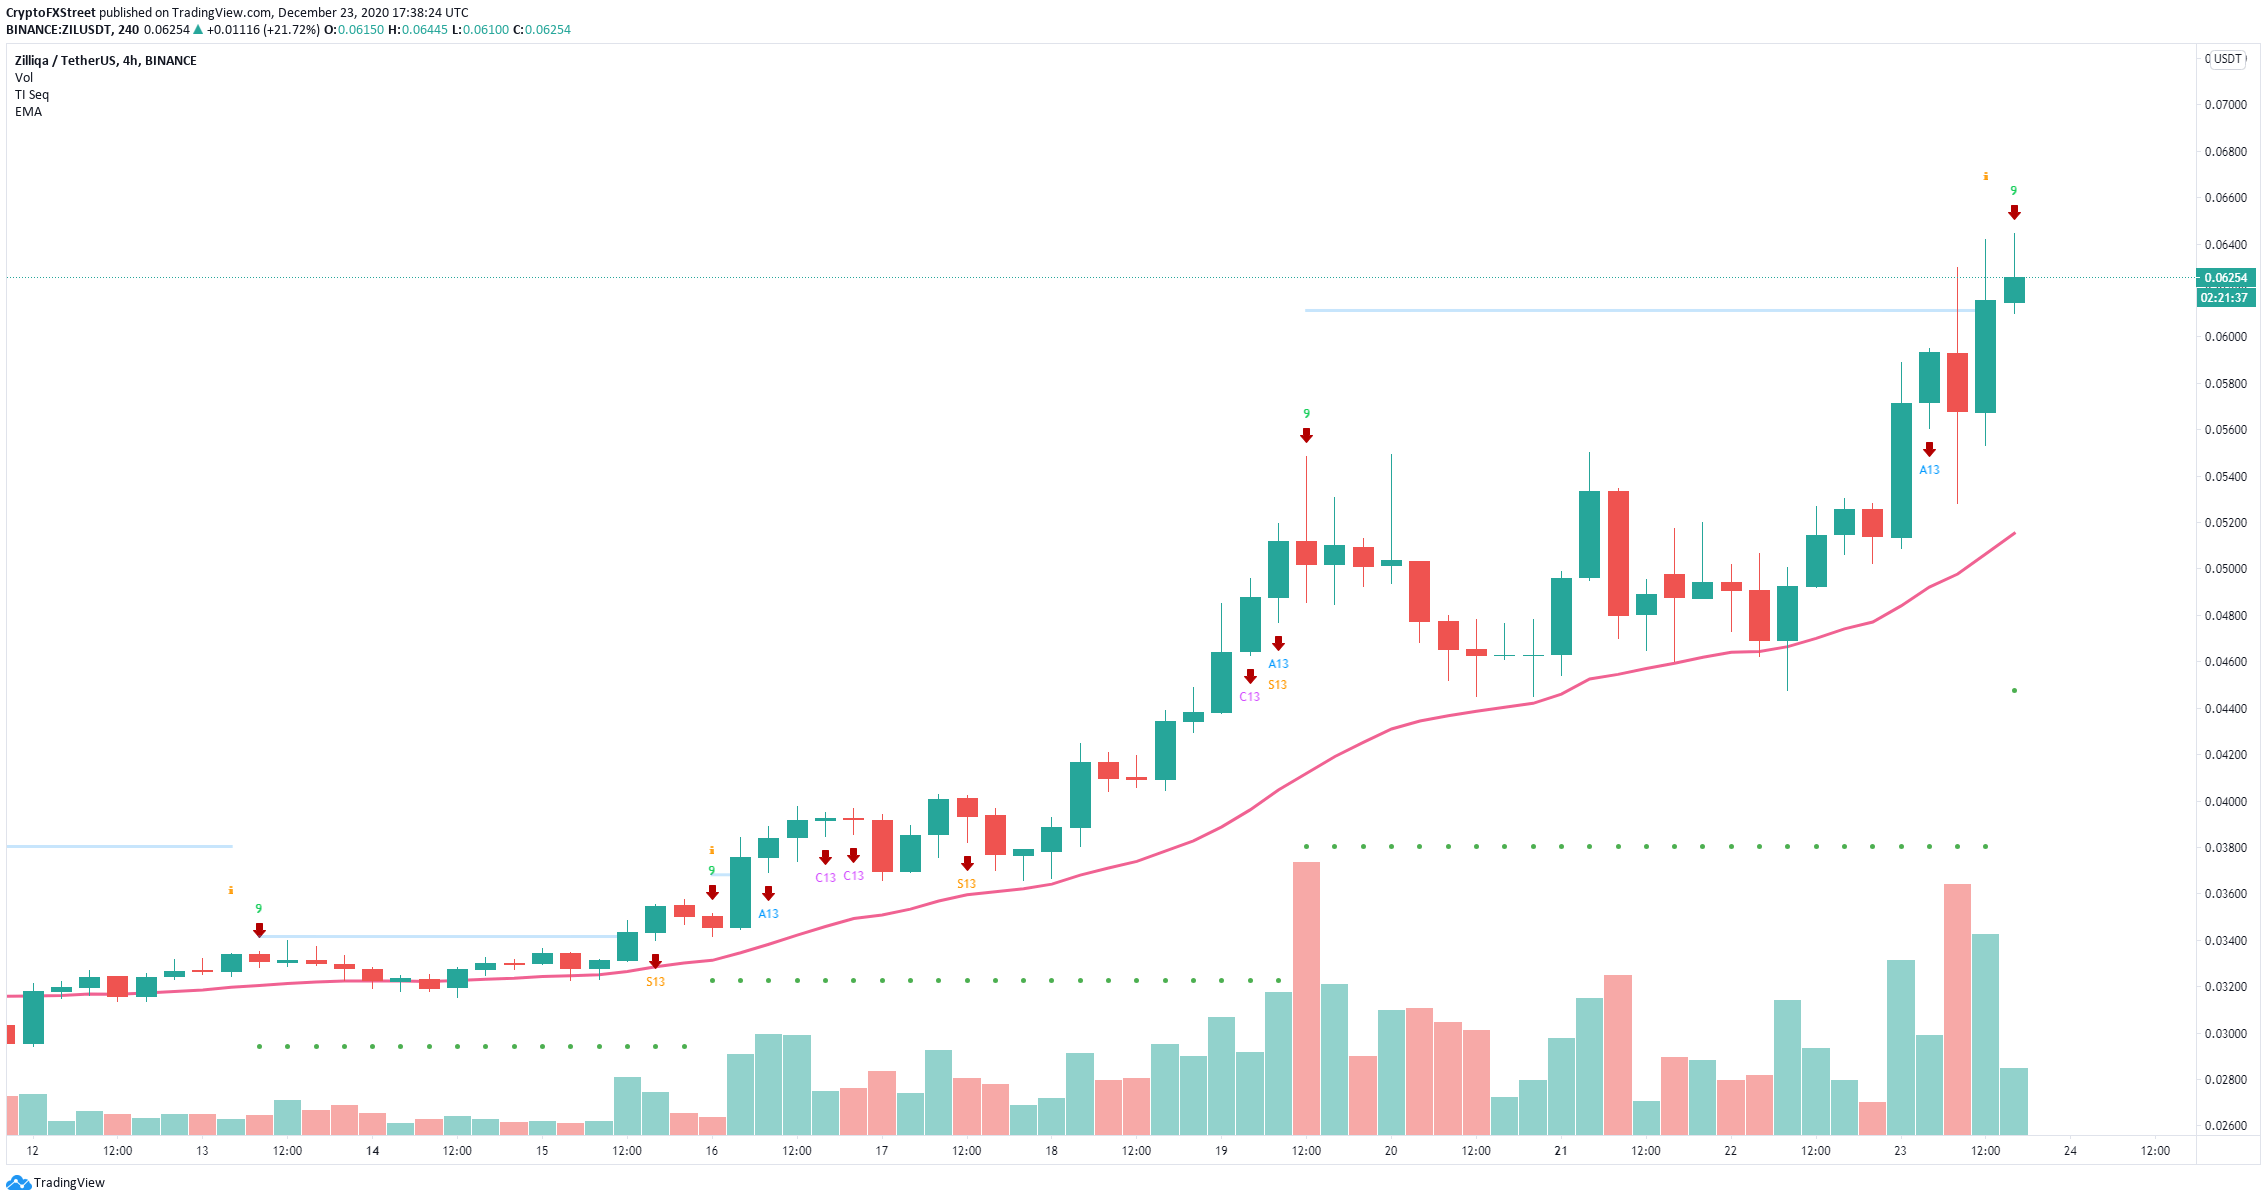
ZIL/USD 4-hour chart
Similarly, on the 3-hour chart, the TD Sequential indicator already presented the same sell signal and Zilliqa price just got rejected from $0.064 after a small attempt to resume the uptrend.
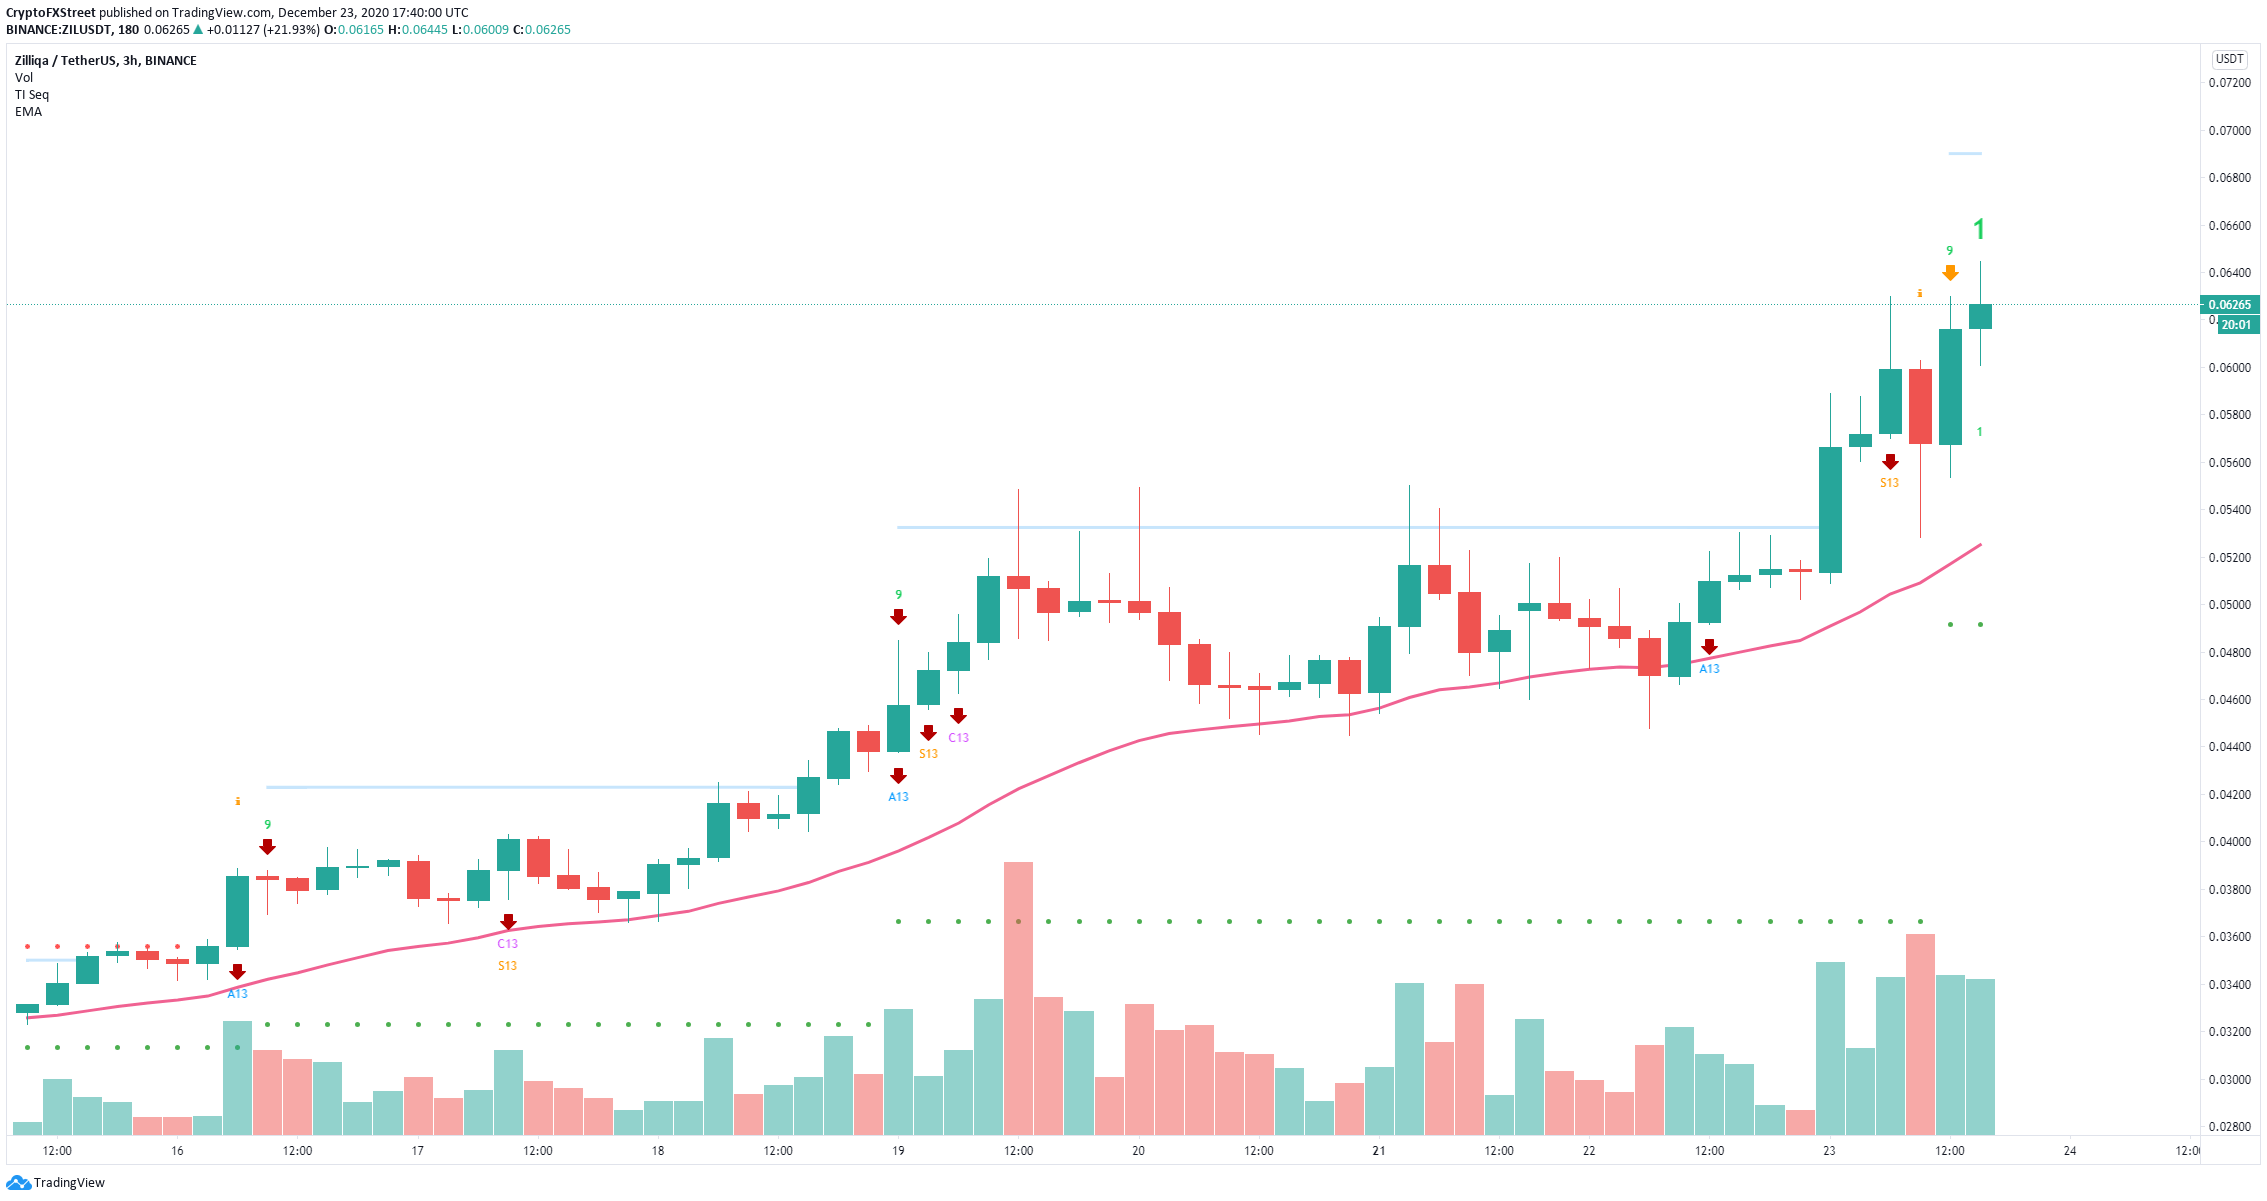
ZIL/USD 3-hour chart
Despite the sell signals, it’s important to remember that Zilliqa remains inside a robust uptrend and faces very little resistance to the upside. The next potential price target for the bulls would be the psychological level at $0.07 if the trend continues.
Note: All information on this page is subject to change. The use of this website constitutes acceptance of our user agreement. Please read our privacy policy and legal disclaimer. Opinions expressed at FXstreet.com are those of the individual authors and do not necessarily represent the opinion of FXstreet.com or its management. Risk Disclosure: Trading foreign exchange on margin carries a high level of risk, and may not be suitable for all investors. The high degree of leverage can work against you as well as for you. Before deciding to invest in foreign exchange you should carefully consider your investment objectives, level of experience, and risk appetite. The possibility exists that you could sustain a loss of some or all of your initial investment and therefore you should not invest money that you cannot afford to lose. You should be aware of all the risks associated with foreign exchange trading, and seek advice from an independent financial advisor if you have any doubts.
Recommended Content
Editors’ Picks
Ripple on-chain metrics show bullish signs amidst legal struggle with SEC, XRP eyes recovery
Ripple made a comeback above $0.48 on Tuesday and hovers above that level in Wednesday’s European session. Ripple on-chain metrics such as transaction volume and Network Realized Profit/Loss have turned bullish, supporting a recovery in the altcoin.
Bitcoin price falls amidst German government transfers, miners activity
Bitcoin (BTC) extends correction on Wednesday and hovers around $61,000 after finding resistance near the $64,000 level on Monday. Recent on-chain data indicates heightened selling activity from Bitcoin miners early in the week.
Crypto Today: Bitcoin erases gains from end of June, Ethereum declines while Ripple holds
Bitcoin wipes out gains from the last week of June and falls below $60,000 on Wednesday. Ethereum and top altcoins ranked by market capitalization erased gains as the inflation outlook worsened. Ripple holds on to recent gains and hovers above $0.48 on Wednesday.
Three reasons why altcoins could shake off losses this week
On-chain data from Santiment shows that altcoins are currently in the opportunity zone, or generating buy signals. The top three altcoins in the buy zone are Basic Attention Token (BAT), Chromia (CHR), and Highstreet (HIGH), per Santiment.
Bitcoin: BTC price correction could end in July, according to seasonal data
Bitcoin (BTC) price appears poised for a decline this week, influenced by slight outflows in US spot ETFs, selling activity among BTC miners, and a combined transfer of 4,690.28 BTC to centralized exchanges by the US and German governments.