- Zilliqa price peaked at $0.036 after a massive 45% move.
- ZIL was trading inside a parallel channel on the daily chart before the breakout.
On November 24, Zilliqa price had an initial small breakout above the parallel channel at $0.0251 with a ton of follow-through in the following 24 hours exploding towards a high of $0.036 and still aiming to hit $0.045.
Zilliqa price breaks out and could potentially reach $0.045
After the massive 45% breakout of a descending parallel channel on the daily chart, the digital asset hit $0.036 for the first time in two years. However, using the pattern's height as a reference, it seems that the ultimate bullish price target is located at $0.045.
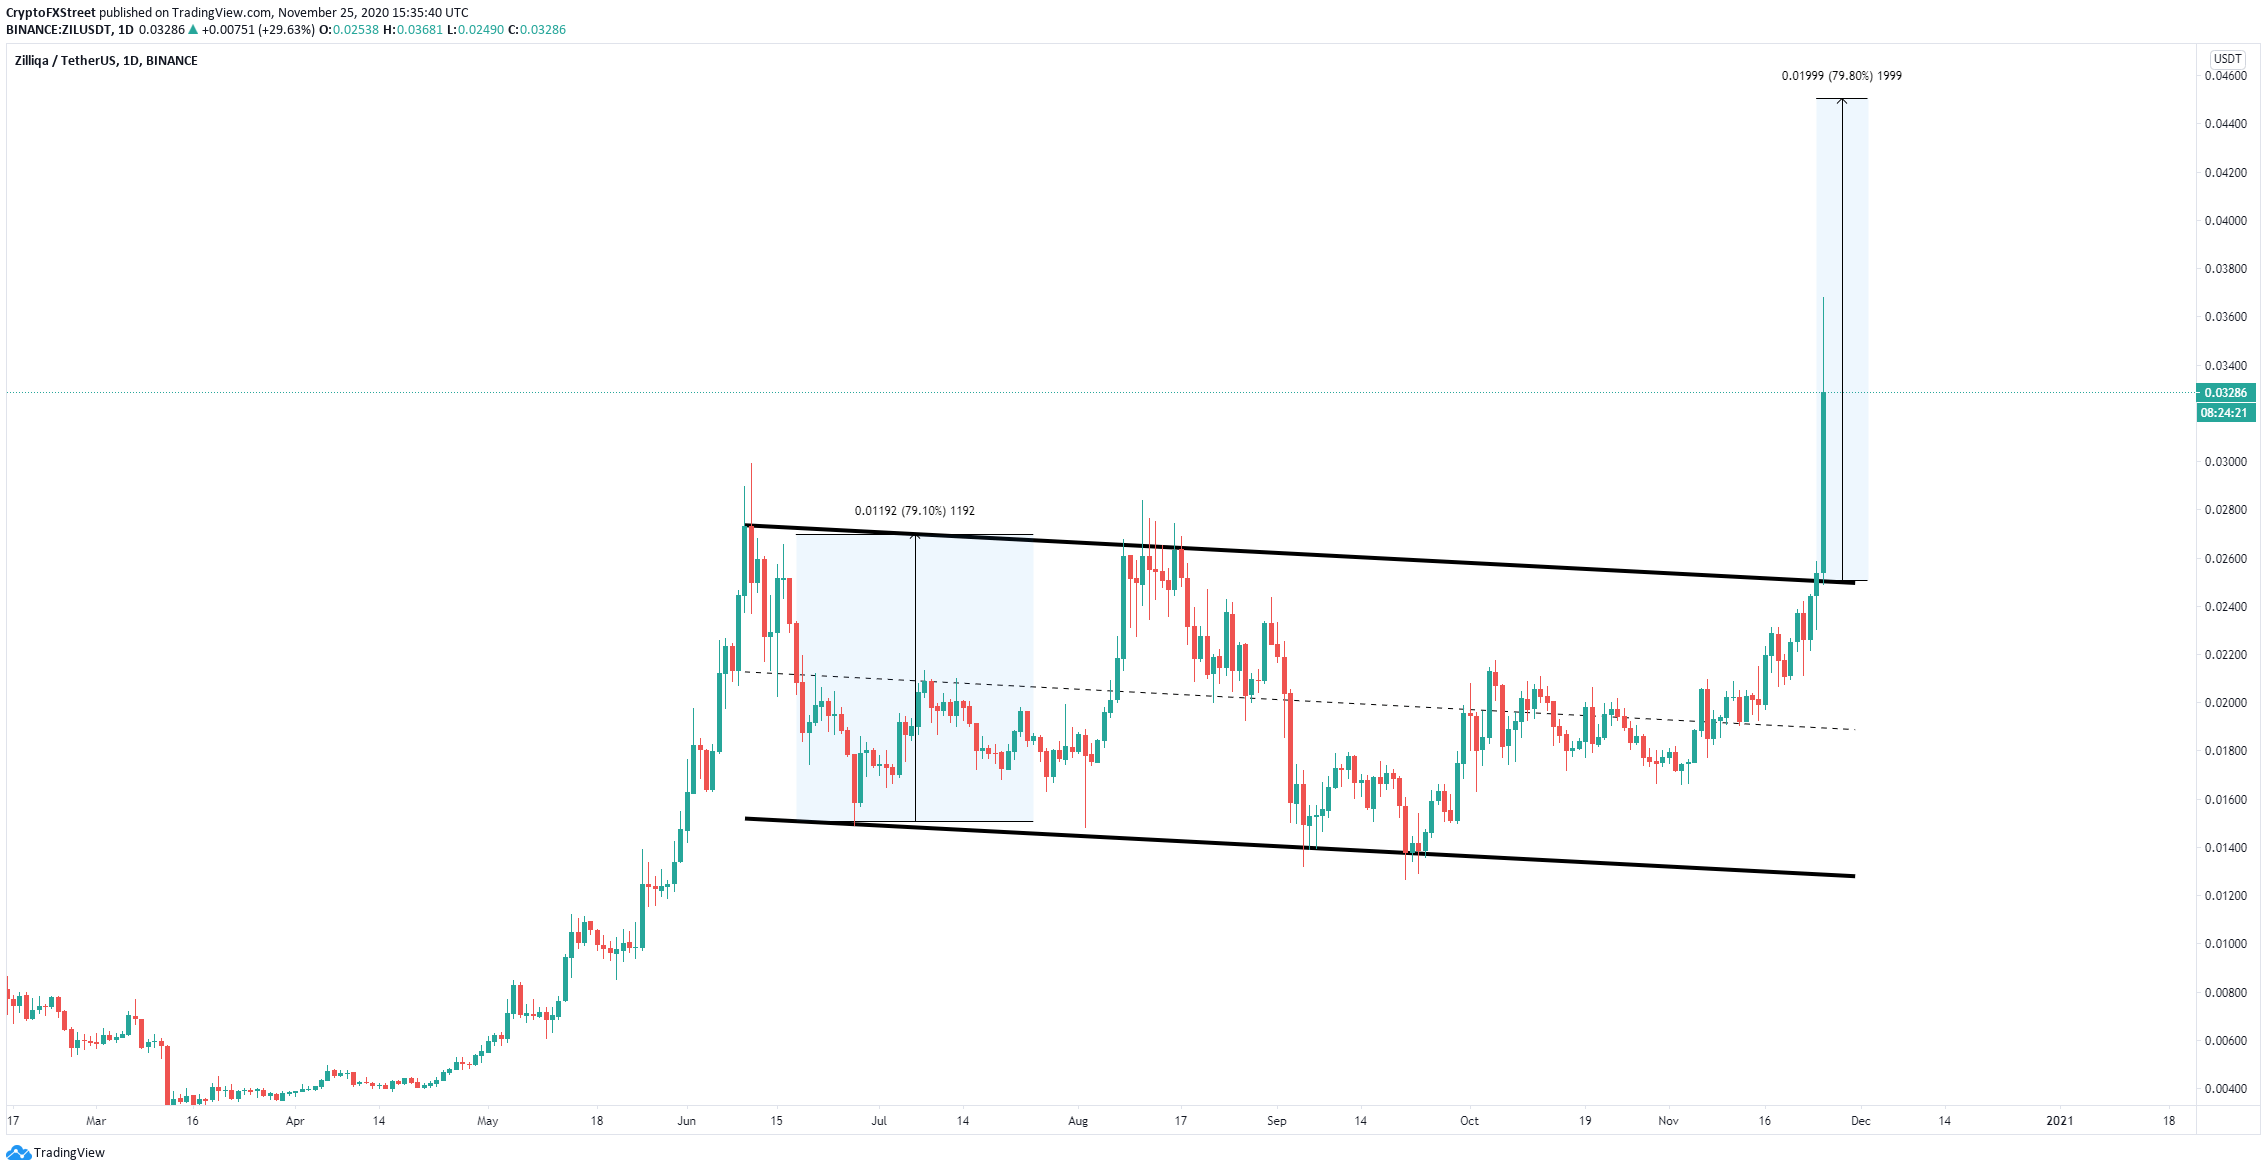
ZIL/USD daily chart
Additionally, this breakout also coincides with another significant breakout above a descending wedge formed on the ZIL/BTC pair months ago. The 120 satoshis region is now marked as the bottom.
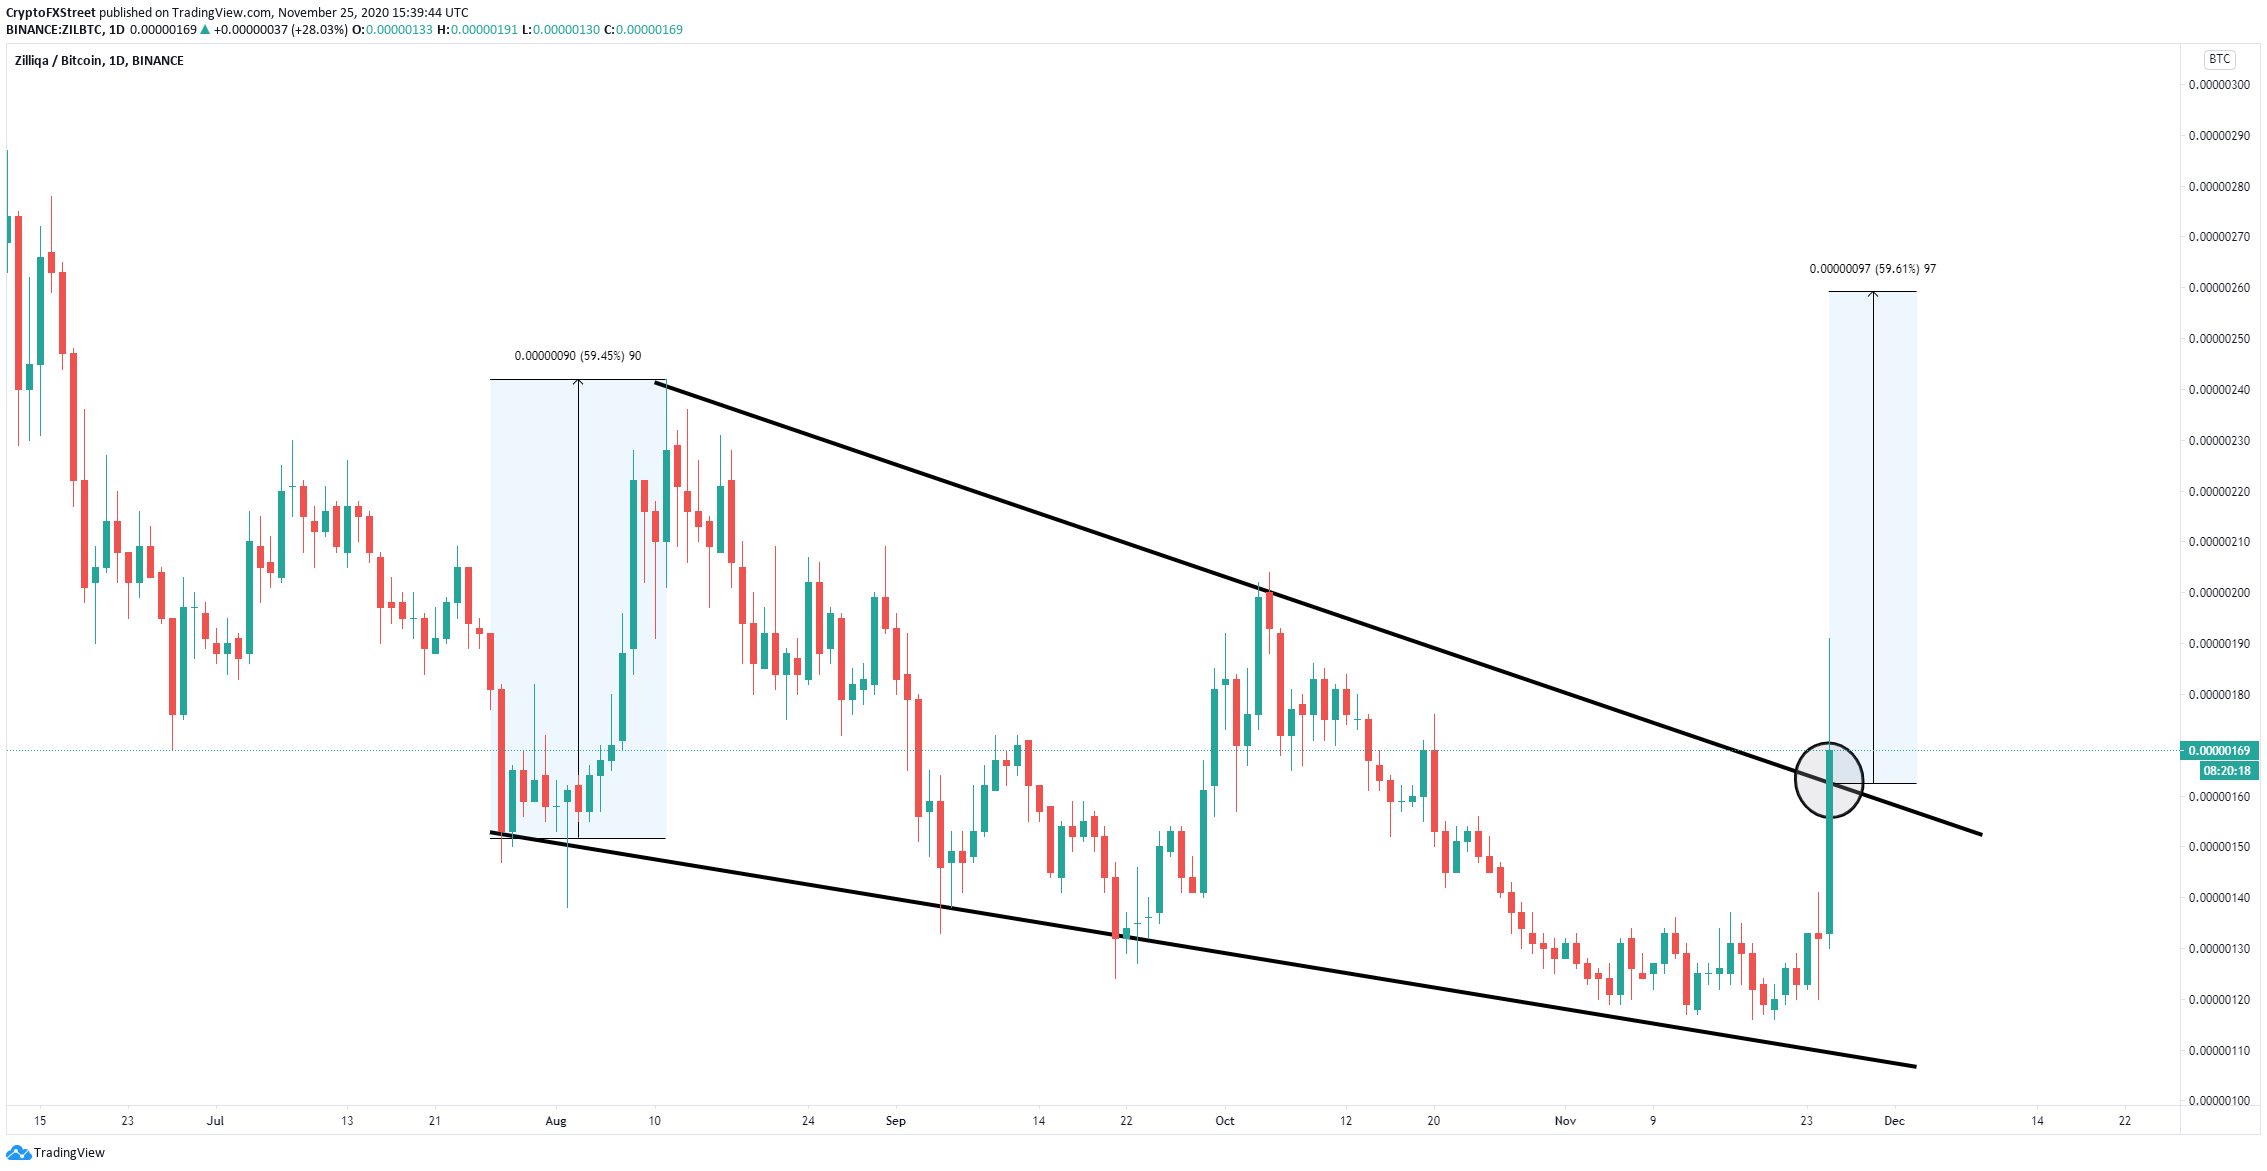
ZIL/BTC daily chart
Using the height of the pattern, it can be determined that the next bullish target for Zilliqa price would be around 260 satoshis. However, despite the breakout, there has been a strong rejection at 191 satoshis.
Zilliqa price is currently only at 169 satoshis, close to the upper boundary of the pattern at 162. Falling below this crucial support level would be a notable bearish sign capable of driving Zilliqa towards the low at 120 satoshis.
Note: All information on this page is subject to change. The use of this website constitutes acceptance of our user agreement. Please read our privacy policy and legal disclaimer. Opinions expressed at FXstreet.com are those of the individual authors and do not necessarily represent the opinion of FXstreet.com or its management. Risk Disclosure: Trading foreign exchange on margin carries a high level of risk, and may not be suitable for all investors. The high degree of leverage can work against you as well as for you. Before deciding to invest in foreign exchange you should carefully consider your investment objectives, level of experience, and risk appetite. The possibility exists that you could sustain a loss of some or all of your initial investment and therefore you should not invest money that you cannot afford to lose. You should be aware of all the risks associated with foreign exchange trading, and seek advice from an independent financial advisor if you have any doubts.
Recommended Content
Editors’ Picks
Ripple on-chain metrics show bullish signs amidst legal struggle with SEC, XRP eyes recovery
![Ripple on-chain metrics show bullish signs amidst legal struggle with SEC, XRP eyes recovery](https://editorial.fxstreet.com/images/Markets/Currencies/Cryptocurrencies/Coins/Ripple/Ripple_Coin_31_02_XtraSmall.jpg)
Ripple made a comeback above $0.48 on Tuesday and hovers above that level in Wednesday’s European session. Ripple on-chain metrics such as transaction volume and Network Realized Profit/Loss have turned bullish, supporting a recovery in the altcoin.
Bitcoin price falls amidst German government transfers, miners activity
![Bitcoin price falls amidst German government transfers, miners activity](https://editorial.fxstreet.com/images/Markets/Currencies/Digital%20Currencies/Bitcoin/bit-coin-symbol-flag-3d-illustration-59931110_XtraSmall.jpg)
Bitcoin (BTC) extends correction on Wednesday and hovers around $61,000 after finding resistance near the $64,000 level on Monday. Recent on-chain data indicates heightened selling activity from Bitcoin miners early in the week.
Crypto Today: Bitcoin erases gains from end of June, Ethereum declines while Ripple holds
![Crypto Today: Bitcoin erases gains from end of June, Ethereum declines while Ripple holds](https://editorial.fxstreet.com/images/Markets/Currencies/Digital%20Currencies/Bitcoin/Bitcoin_2_XtraSmall.jpg)
Bitcoin wipes out gains from the last week of June and falls below $60,000 on Wednesday. Ethereum and top altcoins ranked by market capitalization erased gains as the inflation outlook worsened. Ripple holds on to recent gains and hovers above $0.48 on Wednesday.
Three reasons why altcoins could shake off losses this week
![Three reasons why altcoins could shake off losses this week](https://editorial.fxstreet.com/images/Markets/Currencies/Cryptocurrencies/cryptos_XtraSmall.jpg)
On-chain data from Santiment shows that altcoins are currently in the opportunity zone, or generating buy signals. The top three altcoins in the buy zone are Basic Attention Token (BAT), Chromia (CHR), and Highstreet (HIGH), per Santiment.
Bitcoin: BTC price correction could end in July, according to seasonal data
![Bitcoin: BTC price correction could end in July, according to seasonal data](https://editorial.fxstreet.com/images/Markets/Currencies/Digital%20Currencies/Bitcoin/bitcoin_5_XtraSmall.jpg)
Bitcoin (BTC) price appears poised for a decline this week, influenced by slight outflows in US spot ETFs, selling activity among BTC miners, and a combined transfer of 4,690.28 BTC to centralized exchanges by the US and German governments.