- Zilliqa price is up by more than 60% in the past few days.
- The digital asset has been trading inside a robust uptrend hitting new highs almost every day.
Zilliqa by around 500% since the beginning of November and hasn’t shown many bearish signs just yet. However, some technicals are suggesting that the digital asset might be poised for a significant correction in the short-term.
Zilliqa price could see a strong pullback down to $0.06
Although not 100% confirmed, the TD Sequential indicator seems to be on the verge of presenting a sell signal on the daily chart and the weekly chart. The indicator has presented a green ‘8’ candle on both charts which is usually followed by a green ‘9’ sell signal. If both are confirmed, they can push Zilliqa price down to $0.06, the 12-EMA on the daily chart.
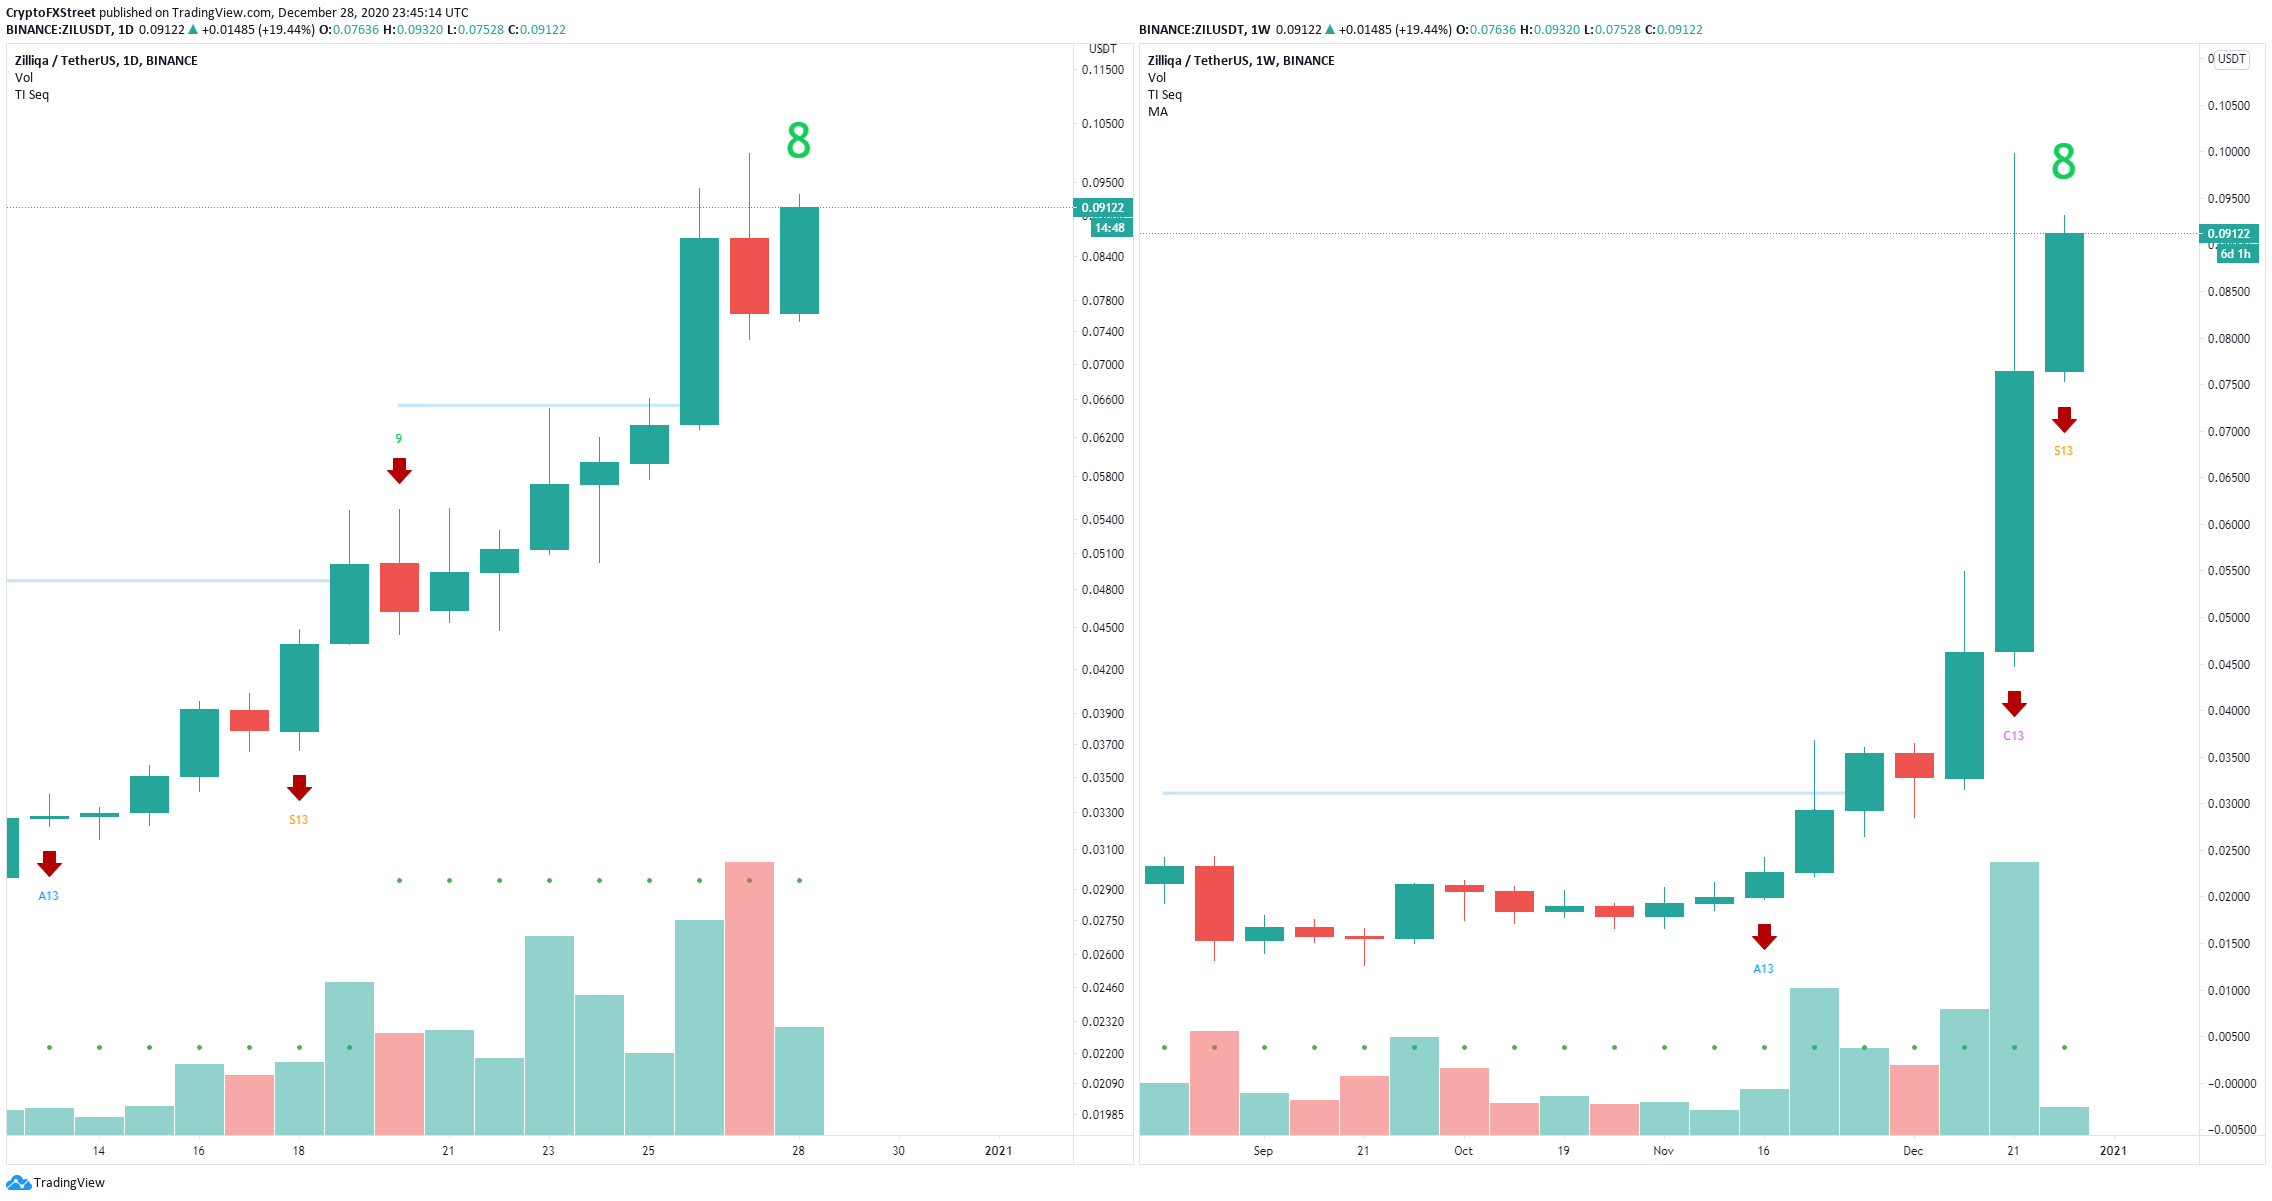
ZIL/USD daily and weekly charts
The social volume of Zilliqa, which measures the mentions of the digital asset on different social media platforms, peaked right before the last sell-off on December 27. This number is increasing again which hints at another potential pullback, giving more credence to the bearish outlook presented above.
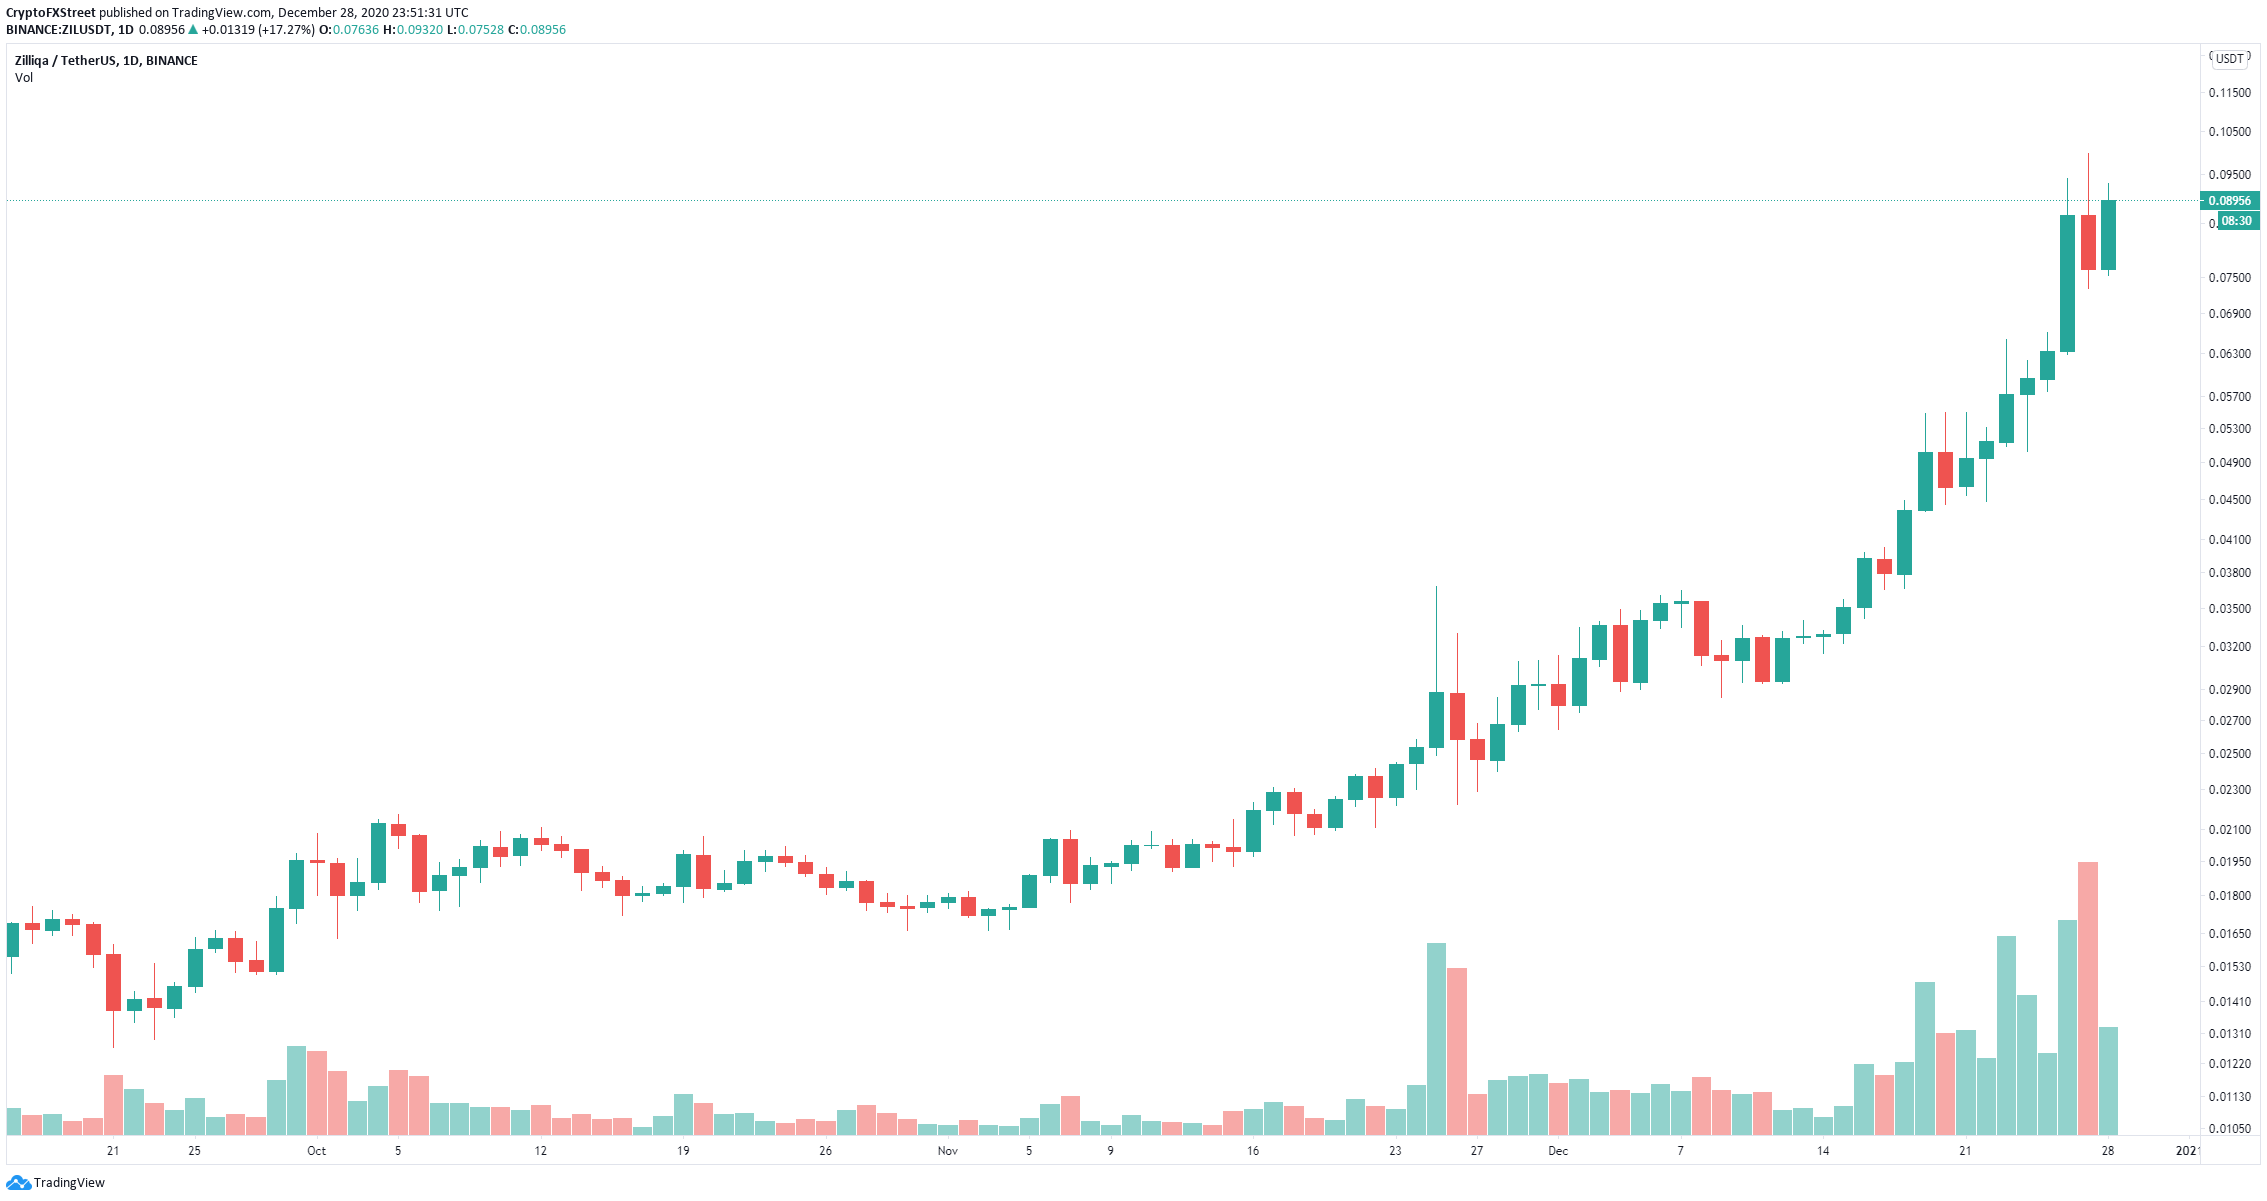
ZIL/USD daily chart
However, despite the several bearish signs, the daily uptrend remains intact. The digital asset is facing very little resistance to the upside as these prices haven’t been seen since June 2018.
Note: All information on this page is subject to change. The use of this website constitutes acceptance of our user agreement. Please read our privacy policy and legal disclaimer. Opinions expressed at FXstreet.com are those of the individual authors and do not necessarily represent the opinion of FXstreet.com or its management. Risk Disclosure: Trading foreign exchange on margin carries a high level of risk, and may not be suitable for all investors. The high degree of leverage can work against you as well as for you. Before deciding to invest in foreign exchange you should carefully consider your investment objectives, level of experience, and risk appetite. The possibility exists that you could sustain a loss of some or all of your initial investment and therefore you should not invest money that you cannot afford to lose. You should be aware of all the risks associated with foreign exchange trading, and seek advice from an independent financial advisor if you have any doubts.
Recommended Content
Editors’ Picks
Ripple on-chain metrics show bullish signs amidst legal struggle with SEC, XRP eyes recovery
Ripple made a comeback above $0.48 on Tuesday and hovers above that level in Wednesday’s European session. Ripple on-chain metrics such as transaction volume and Network Realized Profit/Loss have turned bullish, supporting a recovery in the altcoin.
Bitcoin price falls amidst German government transfers, miners activity
Bitcoin (BTC) extends correction on Wednesday and hovers around $61,000 after finding resistance near the $64,000 level on Monday. Recent on-chain data indicates heightened selling activity from Bitcoin miners early in the week.
Crypto Today: Bitcoin erases gains from end of June, Ethereum declines while Ripple holds
Bitcoin wipes out gains from the last week of June and falls below $60,000 on Wednesday. Ethereum and top altcoins ranked by market capitalization erased gains as the inflation outlook worsened. Ripple holds on to recent gains and hovers above $0.48 on Wednesday.
Three reasons why altcoins could shake off losses this week
On-chain data from Santiment shows that altcoins are currently in the opportunity zone, or generating buy signals. The top three altcoins in the buy zone are Basic Attention Token (BAT), Chromia (CHR), and Highstreet (HIGH), per Santiment.
Bitcoin: BTC price correction could end in July, according to seasonal data
Bitcoin (BTC) price appears poised for a decline this week, influenced by slight outflows in US spot ETFs, selling activity among BTC miners, and a combined transfer of 4,690.28 BTC to centralized exchanges by the US and German governments.