Zilliqa Price Analysis: ZIL sets the pace for massive recovery beyond $0.2
- Zilliqa bulls are focused on sustaining the uptrend based on the MACD.
- ZIL may explode above $0.2 if short-term resistance at $0.18 comes out of the way.
- Support at the 50 SMA and the 100 SMA on the 4-hour chart must hold to avoid losses back to $0.145.

Zilliqa's recovery seems to have started after securing support at $0.145. The token is trading at $0.178 while bulls battle for gains above $0.20. Short term resistance at $0.18 is delaying price movements but once broken, ZIL will be on the way to higher highs beyond $0.2.
Zilliqa focuses on sustaining the uptrend
The Moving Average Convergence Divergence (MACD) shows that ZIL is in the hands of the bulls. This indicator is used to predict the positions to buy the dip and sell the top. When the MACD line (blue) crosses above the signal line, it implies that the trend is flipping bullish. On the other hand, it would be time to sell if the MACD line crosses beneath the signal line.
Meanwhile, the MACD is in the positive region in addition to the bullish divergence. A break past the immediate resistance at $0.18 would trigger many buy orders as investors speculate upsurge beyond $0.2.
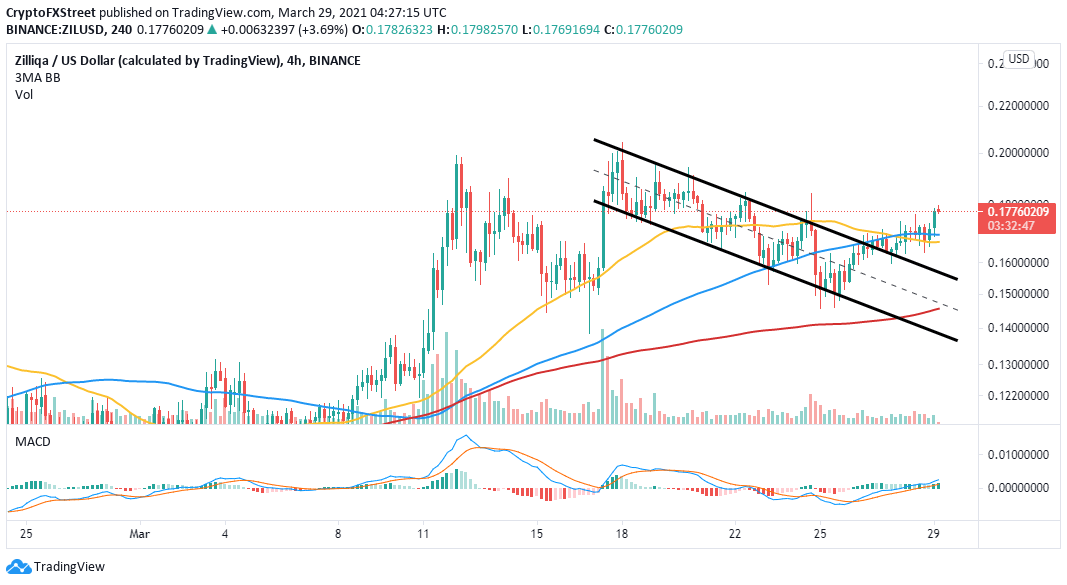
ZIL/USD 4-hour chart
The 12-hour SuperTrend indicator is also bullish, as illustrated on the chart. This indicator is also used to identify the general trend of the market. When it turns green, it suggests that traders should consider taking a long position in the asset. On the other hand, when the SuperTrend indicator turns green and moves above the price, the trend is mainly bearish.
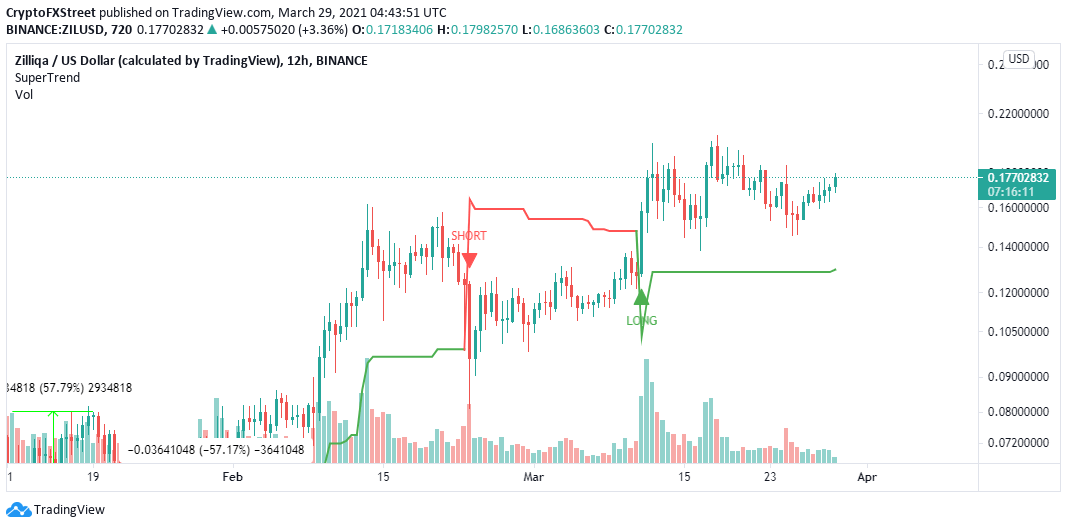
ZIL/USD 12-hour chart
Looking at the other side of the fence
A correction will come into play if the resistance at $0.18 remains unshaken. Tentative support is expected at the 100 Simple Moving Average (SMA) on the 4-hour chart and the 100 50 SMA. However, if push comes to shove, ZIL will seek support within the descending parallel channel or the primary anchor at $0.145.
Author

John Isige
FXStreet
John Isige is a seasoned cryptocurrency journalist and markets analyst committed to delivering high-quality, actionable insights tailored to traders, investors, and crypto enthusiasts. He enjoys deep dives into emerging Web3 tren


