![]() Rajarshi Mitra
Rajarshi Mitra
Independent Analyst
- Zcash will be going through a halving in a little over 53 days.
- The price faces a strong resistance wall at $65, as per the IntoTheBlock’s IOMAP.
Zcash has a little over 53 days left before it goes through the next halving event. Similar to Bitcoin, Zcash also goes through a halving event every four years. The current block reward happens to be 6.25 ZEC, which will drop to 3.125 ZEC following the halving. The halving process is done to keep the supply of the coins in check.
As such, this should incentivize the holders to strengthen their positions as much as they possibly can. Ryan Selkis, the founder at Messari crypto, seems to be one of those investors precisely doing that.
Just added 40% to my $ZEC position.
— Ryan Selkis (@twobitidiot) September 23, 2020
Now, how is this affecting the price, if at all? Let’s take a look.
ZEC/USD daily chart
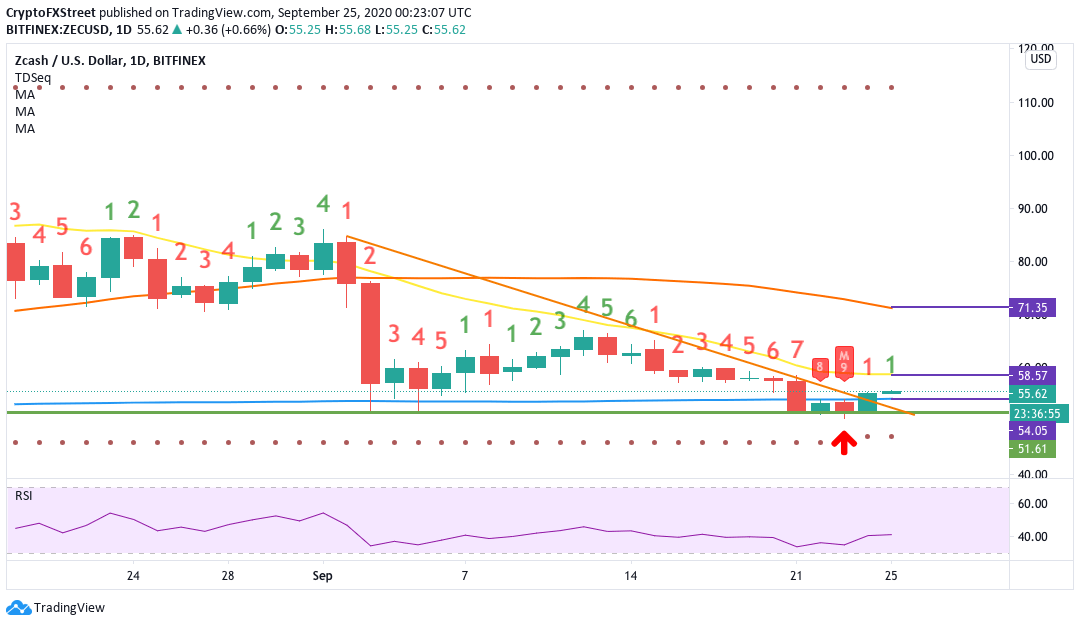
ZEC/USD daily chart flashed the buy signal on the TD sequential. Following that, the buyers pushed the price above the descending triangle formation. In the process, ZEC managed to break above the SMA 200 curve. Up next, the price should aim for the SMA 20 curve, which it can do so by pushing up to $57.55.
To get a clearer picture of this whole scenario, let’s check out the IntoTheBlock’s “In/Out of the Money Around Price” (IOMAP) model.
ZEC IOMAP
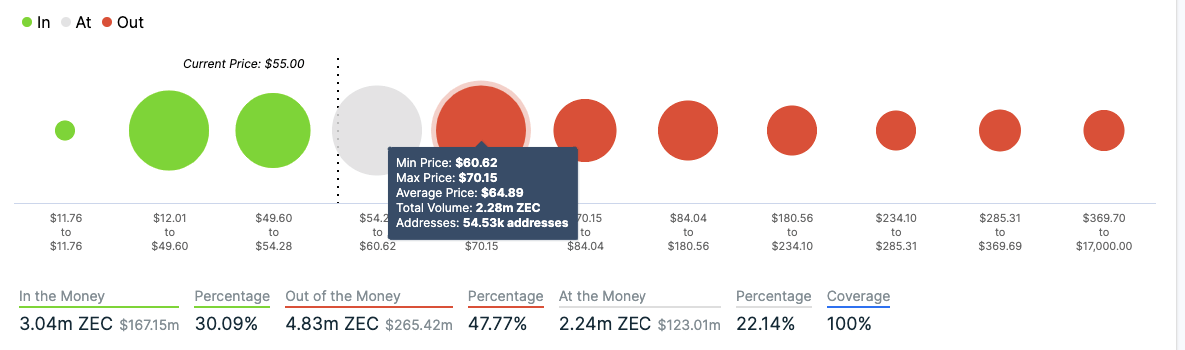
As per the IOMAP, the privacy coin is currently sandwiched between strong resistance and support levels. On the upside, there is a strong resistance wall at $65, where 54.5k addresses had previously bought 2.28M ZEC coins. If the buyers gain enough momentum to break through this level, the subsequent resistance walls are progressively weaker.
On the downside, the price has sufficiently strong support walls at $51.50 and $30.50 to absorb any selling pressure.
ZEC/USD 12-hour chart
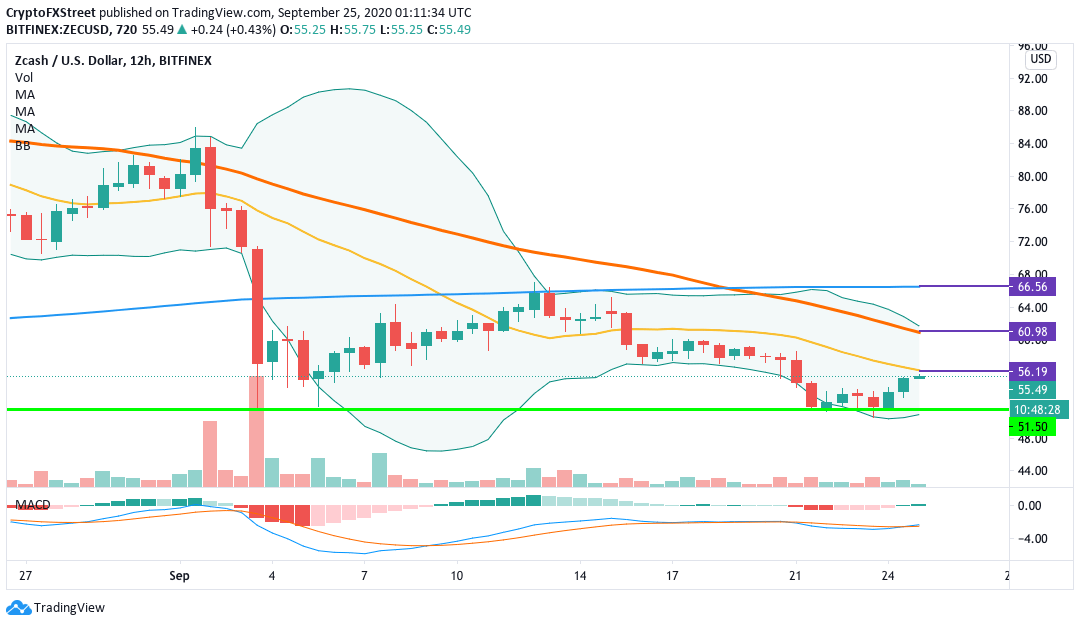
ZEC has bounced up from the $51.50 support line and managed to have three bullish sessions in the 12-hour chart. Currently, the price is looking to cross above the SMA 20 curve ($56.20). The MACD shows that market momentum has reversed from bearish to bullish. The buyers must leverage this momentum to break past SMA 20 and then aim for the SMA 50 ($61).
ZEC 4-hour chart
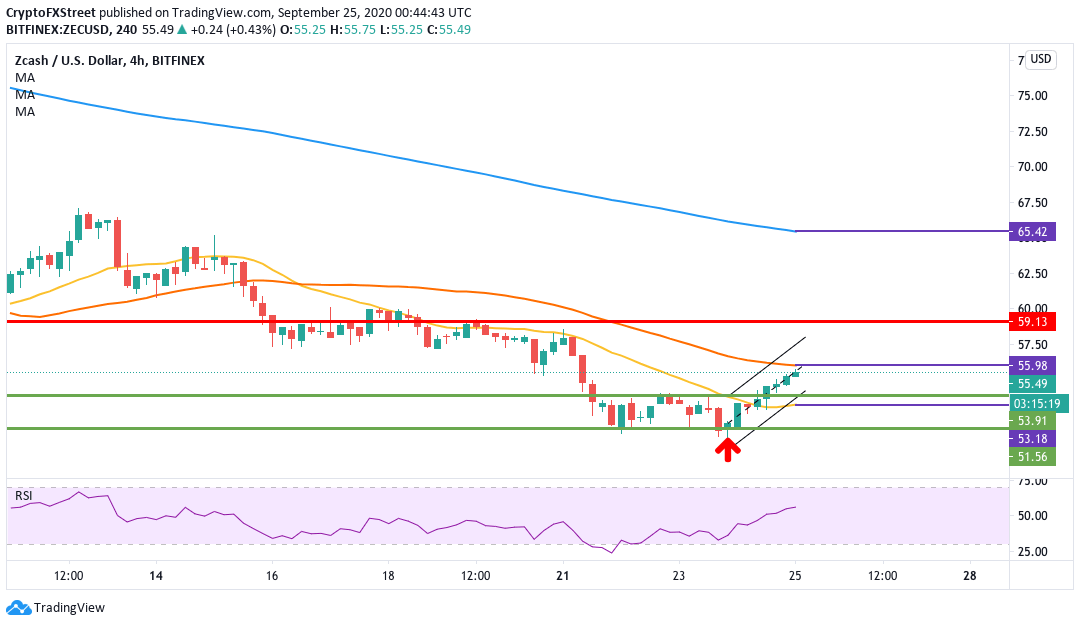
ZEC/USD has been moving up in a flag formation after the price charted the morning star pattern. The price will look to break above the SMA 50 ($56). The relative strength index (RSI) is hovering around 56, showing that it still has some room to move till it reaches the overbought zone. This should give the bulls the license to go for the kill, pass the SMA 50 and aim for the $59 resistance level.
Want to know more about what's going on in the cryptoverse? Check out our report.
Note: All information on this page is subject to change. The use of this website constitutes acceptance of our user agreement. Please read our privacy policy and legal disclaimer. Opinions expressed at FXstreet.com are those of the individual authors and do not necessarily represent the opinion of FXstreet.com or its management. Risk Disclosure: Trading foreign exchange on margin carries a high level of risk, and may not be suitable for all investors. The high degree of leverage can work against you as well as for you. Before deciding to invest in foreign exchange you should carefully consider your investment objectives, level of experience, and risk appetite. The possibility exists that you could sustain a loss of some or all of your initial investment and therefore you should not invest money that you cannot afford to lose. You should be aware of all the risks associated with foreign exchange trading, and seek advice from an independent financial advisor if you have any doubts.
Recommended Content
Editors’ Picks

Bitcoin holds $84,000 despite Fed’s hawkish remarks and spot ETFs outflows
Bitcoin is stabilizing around $84,000 at the time of writing on Thursday after facing multiple rejections around the 200-day EMA at $85,000 since Saturday. Despite risk-off sentiment due to the hawkish remarks by the US Fed on Wednesday, BTC remains relatively stable.

Crypto market cap fell more than 18% in Q1, wiping out $633.5 billion after Trump’s inauguration top
CoinGecko’s Q1 Crypto Industry Report highlights that the total crypto market capitalization fell by 18.6% in the first quarter, wiping out $633.5 billion after topping on January 18, just a couple of days ahead of US President Donald Trump’s inauguration.

Top meme coin gainers FARTCOIN, AIDOGE, and MEW as Trump coins litmus test US SEC ethics
Cryptocurrencies have been moving in lockstep since Monday, largely reflecting sentiment across global markets as United States (US) President Donald Trump's tariffs and trade wars take on new shapes and forms each passing day.

XRP buoyant above $2 as court grants Ripple breathing space in SEC lawsuit
A US appellate court temporarily paused the SEC-Ripple case for 60 days, holding the appeal in abeyance. The SEC is expected to file a status report by June 15, signaling a potential end to the four-year legal battle.
Bitcoin Weekly Forecast: Market uncertainty lingers, Trump’s 90-day tariff pause sparks modest recovery
Bitcoin (BTC) price extends recovery to around $82,500 on Friday after dumping to a new year-to-date low of $74,508 to start the week. Market uncertainty remains high, leading to a massive shakeout, with total liquidations hitting $2.18 billion across crypto markets.

The Best brokers to trade EUR/USD
SPONSORED Discover the top brokers for trading EUR/USD in 2025. Our list features brokers with competitive spreads, fast execution, and powerful platforms. Whether you're a beginner or an expert, find the right partner to navigate the dynamic Forex market.