You do not want to be near Polygon’s MATIC when it implodes
- Polygon price tanks over 10% as the US opening bell gets this Friday underway.
- MATIC price tanks are on the back of a sudden souring mood in the markets with traders focussed on tail risks.
- Expect to see an imposing of another 25% that could spiral into 57% losses as the summer rally gets beheaded.

Polygon (MATIC) price has been breaking through the green ascending trend line like a knife through butter as several major currencies are selling off against the mighty dollar, which is gaining across the board. Currently, the falling knife has been caught, but the pressure of the US session is cutting into the hands and portfolios of bulls. Expect to see the correction continue as long as the dollar strength remains persistent relative to other normal currencies and cryptocurrencies.
MATIC price could implode 57% over the weekend
Polygon price proves unable to withstand all the headwinds emerging again as traders get back from their holidays and pick up where they left off at the beginning of the summer. The result is a telling over 15% reduction in the summer rally, and another 57% drop poised to unfold. US equities are dropping like a stone as elements appear that suggest the summer rally was just a typical bear market correction which will now drop to make new lows for the year.
MATIC price is brushing against the supportive 55-day Simple Moving Average (SMA) at the moment and could break once losses grow during the US equities trading session. From there, another 25% drop is set to unfold towards $0.600 with a historic pivotal level, the S1 support level and another supportive level all at around $0.545. Over the weekend, a bounce is unlikely to materialise and price action could slip even lower towards $0.300, which means that all the gains of the summer will have been erased in just a few days.
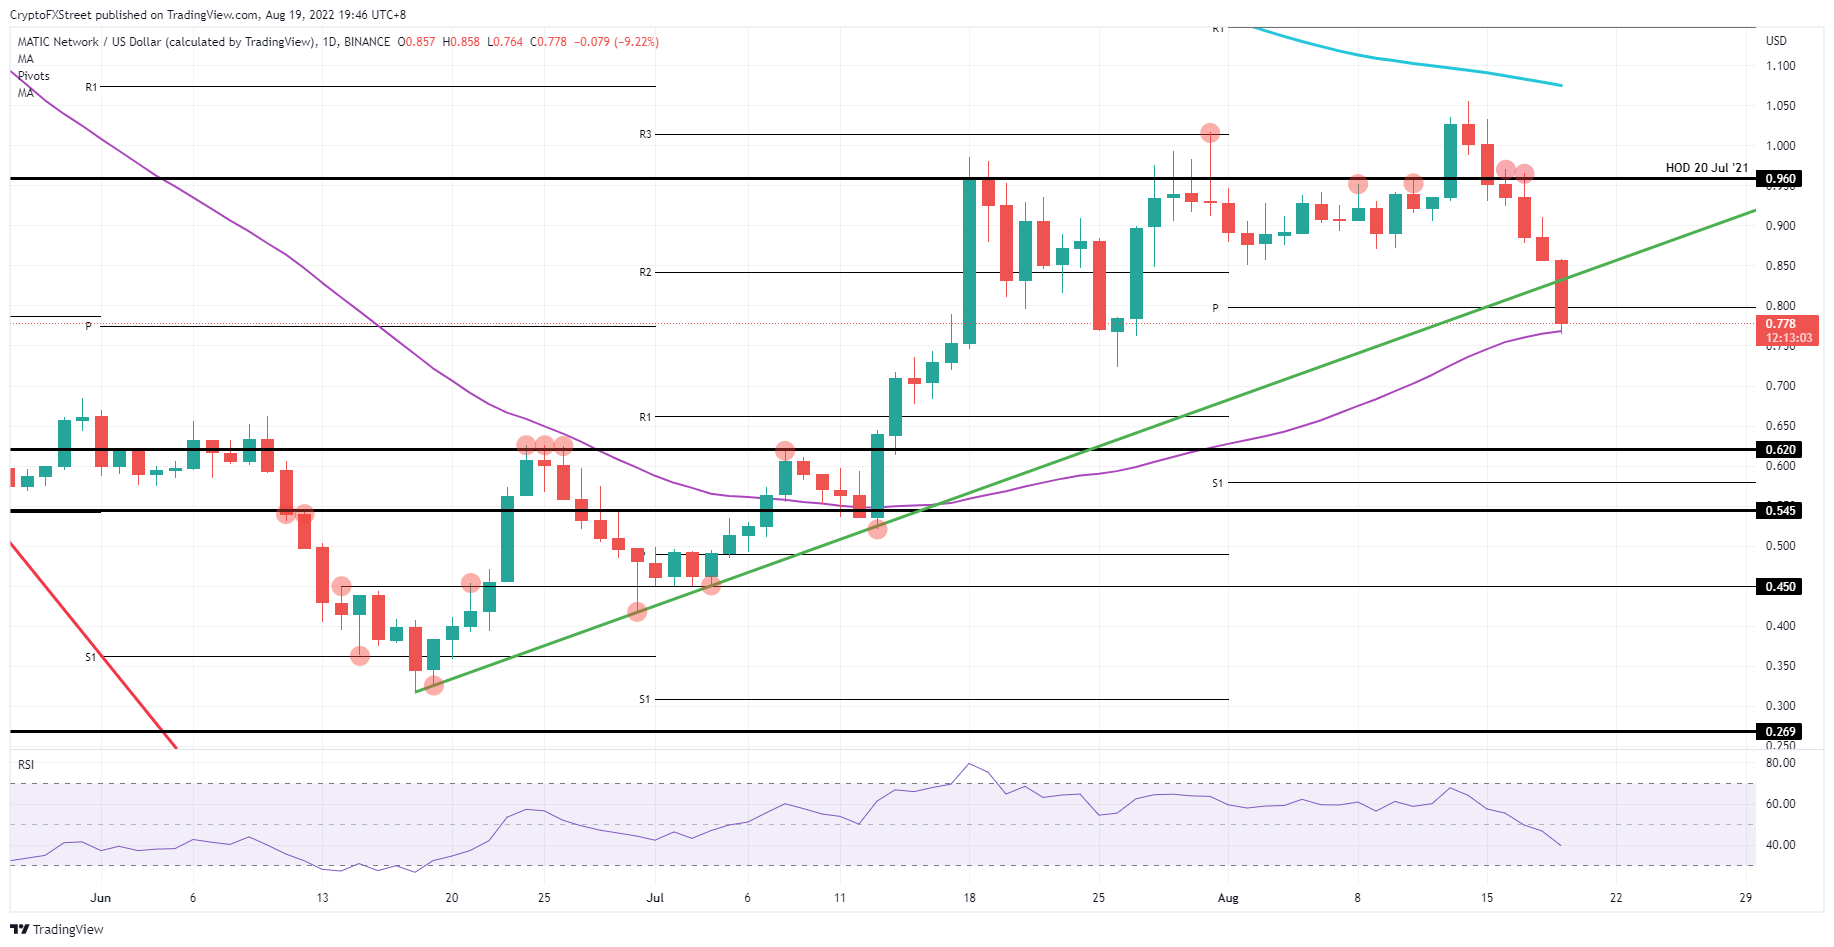
MATIC/USD Daily chart
Alternatively, if the 55-day SMA proves to be much stronger and more resilient than expected bulls could come in to push price action back above the ascending trend line. In such a scenario, a 12% gain could be on the table as price action gets back to $0.960 and tests or even breaks the July 20, 2021, high, with bulls trying to squeeze as many bears as they can. Depending on the current geopolitical risks, maybe even $1.050 could be on the cards near the end of August.
Author

Filip Lagaart
FXStreet
Filip Lagaart is a former sales/trader with over 15 years of financial markets expertise under its belt.


