![]() Aaryamann Shrivastava
Aaryamann Shrivastava
FXStreet
- YGG price dropped by a little over 4% on Monday to trade at $0.3645.
- Yield Guild Games was expected to witness a further decline, given about 16.69 million YGG tokens were unlocked on November 27.
- The token unlock event did, however, advance the downtrend, which could push YGG towards critical support of 23.6% Fibonacci Retracement.
YGG price was expected to take a hit on November 27 in lieu of the token unlock event that took place during the day. Interestingly, this was not the case as the altcoin managed to not only deflect damage but also retain investors’ profits.
Yield Guild Games token unlock
Yield Guild Games, the biggest web3 gaming guild, witnessed a major token unlock event on Monday wherein 16.69 million YGG tokens were flooded into the market. These tokens represent nearly 5.83% of the entire circulating supply of 284.9 million YGG.
Valued at $6.05 million, these tokens surprisingly did not cause a bearish development. Generally, token unlock events tend to cause a price crash or initiate a downtrend momentum. This is caused by the sudden flood of assets into the market, which then leads to an increase in supply while the demand remains the same.
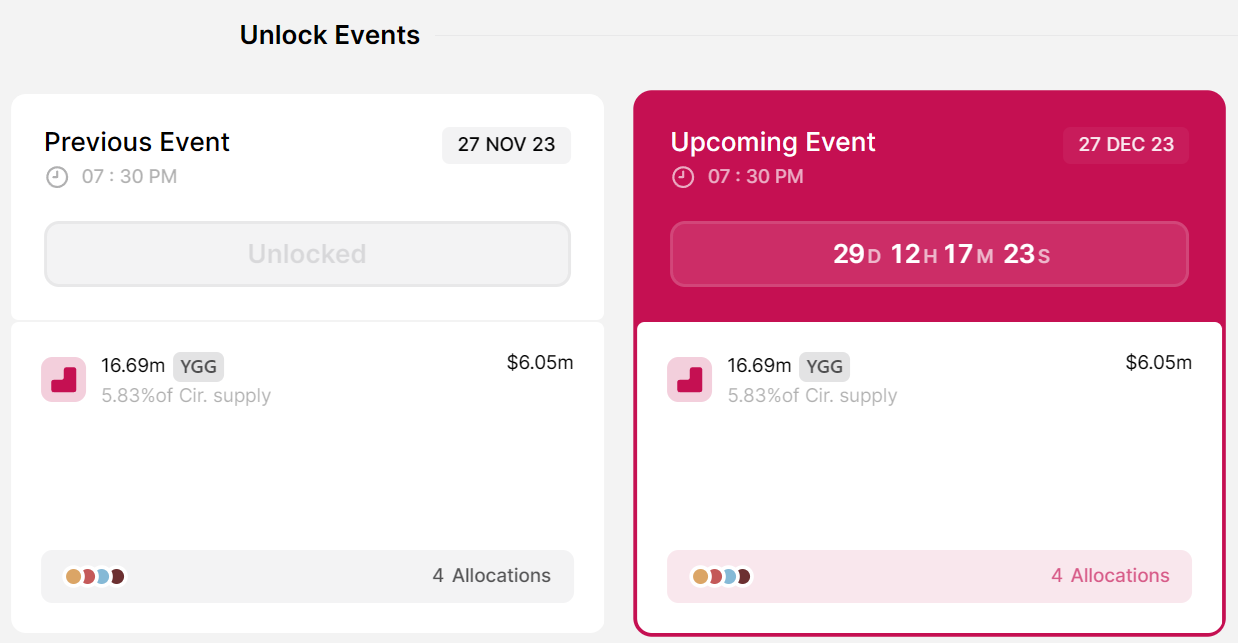
YGG token unlock event
If the demand, however, matches the supply flood, then the assets tend to minimize the decline, which was the case with YGG as well. Yield Guild Games has another token unlock scheduled after 29 days, which will see the same amount of YGG tokens - 16.69 million - valued at $6.05 million entering the market.
Whether the price reacts or not is yet to be seen
YGG price tests support
YGG price on the daily chart slipped by a little over 4% following the token unlock event, bringing the price to $0.3646. The altcoin is presently testing the 50.0% Fibonacci Retracement of $0.5439 to $0.1835, marked at $0.3637. This line has been tested as both support and resistance in the past, making it crucial to ascertain the next leg of the price action.
If this support line is lost, the YGG price would most likely test the 38.2% Fibonacci Retracement line at $0.3212. The Moving Average Convergence Divergence (MACD) has witnessed a bearish convergence. Furthermore, the appearance of the red bars on the histogram confirms that the altcoin is more susceptible to extended decline.
The cryptocurrency, however, would lose its recent gains if the support line of the 23.6% Fibonacci Retracement at $0.2686 is lost.
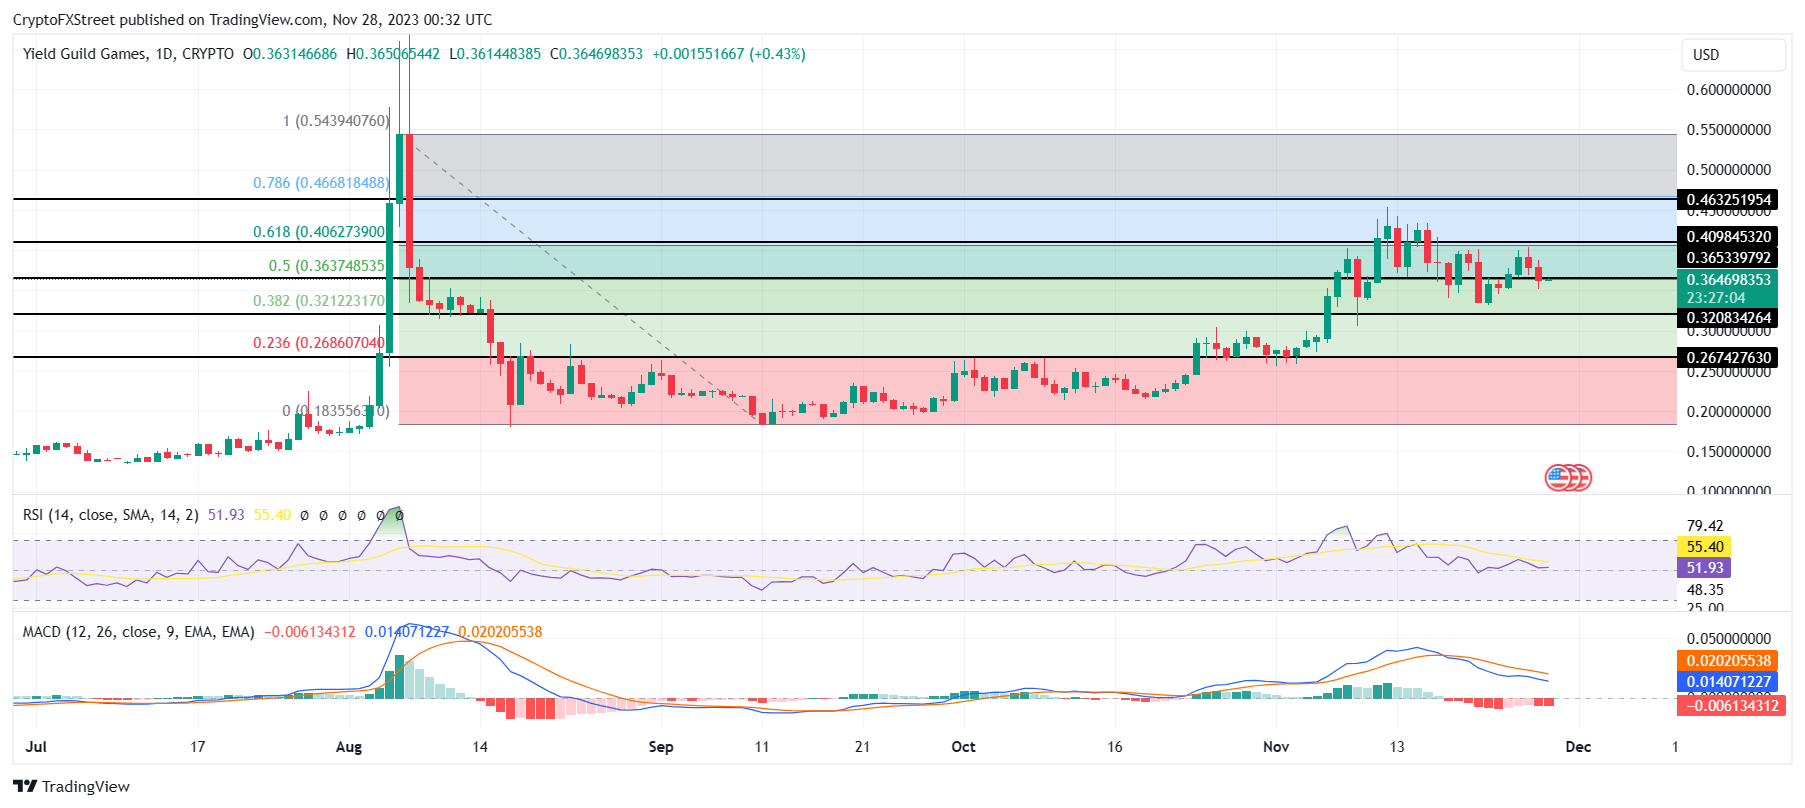
YGG/USD 1-day chart
But if YGG price manages to reclaim the 61.8% Fibonacci Retracement marked at $0.4062 as a support floor, it would be able to rise further. This would invalidate the bearish thesis and set YGG up to mark a fresh three-month high.
Information on these pages contains forward-looking statements that involve risks and uncertainties. Markets and instruments profiled on this page are for informational purposes only and should not in any way come across as a recommendation to buy or sell in these assets. You should do your own thorough research before making any investment decisions. FXStreet does not in any way guarantee that this information is free from mistakes, errors, or material misstatements. It also does not guarantee that this information is of a timely nature. Investing in Open Markets involves a great deal of risk, including the loss of all or a portion of your investment, as well as emotional distress. All risks, losses and costs associated with investing, including total loss of principal, are your responsibility. The views and opinions expressed in this article are those of the authors and do not necessarily reflect the official policy or position of FXStreet nor its advertisers. The author will not be held responsible for information that is found at the end of links posted on this page.
If not otherwise explicitly mentioned in the body of the article, at the time of writing, the author has no position in any stock mentioned in this article and no business relationship with any company mentioned. The author has not received compensation for writing this article, other than from FXStreet.
FXStreet and the author do not provide personalized recommendations. The author makes no representations as to the accuracy, completeness, or suitability of this information. FXStreet and the author will not be liable for any errors, omissions or any losses, injuries or damages arising from this information and its display or use. Errors and omissions excepted.
The author and FXStreet are not registered investment advisors and nothing in this article is intended to be investment advice.
Recommended Content
Editors’ Picks

Polygon joins forces with WSPN to expand stablecoin adoption
WSPN, a stablecoin infrastructure company based in Singapore, has teamed up with Polygon Labs to make its stablecoin, WUSD, more useful in payment and decentralized finance.

Coinbase envisages listing of more meme coins amid regulatory optimism
Donald Trump's expected return to the White House creates excitement in the cryptocurrency sector, especially at Coinbase, the largest US-based crypto exchange. The platform is optimistic that the new administration will focus on regulatory clarity, which could lead to more token listings, including popular meme coins.

Cardano's ADA leaps to 2.5-year high of 90 cents as whale holdings exceed $12B
As Bitcoin (BTC) gets closer to the $100,000 mark for the first time — it crossed $99,000 earlier Friday — capital is rotating into alternative cryptocurrencies, creating a buzz in the broader crypto market.
Shiba Inu holders withdraw 1.67 trillion SHIB tokens from exchange
Shiba Inu trades slightly higher, around $0.000024, on Thursday after declining more than 5% the previous week. SHIB’s on-chain metrics project a bullish outlook as holders accumulate recent dips, and dormant wallets are on the move, all pointing to a recovery in the cards.

Bitcoin: Rally expected to continue as BTC nears $100K
Bitcoin (BTC) reached a new all-time high of $99,419, just inches away from the $100K milestone and has rallied over 9% so far this week. This bullish momentum was supported by the rising Bitcoin spot Exchange Traded Funds (ETF), which accounted for over $2.8 billion inflow until Thursday. BlackRock and Grayscale’s recent launch of the Bitcoin ETF options also fueled the rally this week.

Best Forex Brokers with Low Spreads
VERIFIED Low spreads are crucial for reducing trading costs. Explore top Forex brokers offering competitive spreads and high leverage. Compare options for EUR/USD, GBP/USD, USD/JPY, and Gold.