- Whales holding YFI stream in as the decentralized finance token nears a potential bottom.
- A spike in daily active addresses points towards network growth and a possible recovery in the near term.
Yearn.finance has corrected a whopping 78% from its all-time highs of $44,000. Buyers tried to hold the decentralized finance (DeFi) token above $20,000 to no avail. The declines progressed to the extent YFI dived below Bitcoin's value, becoming the second most expensive cryptocurrency in the world.
On-chain metrics suggest YFI is bottoming
It is usual for a long-term downtrend to hit an elastic limit, giving into an uptrend. As for YFI, multiple on-chain metrics signal a potential bottom, with a high likelihood of a reversal occurring. According to Santiment, a leading provider of on-chain data, a spike in the daily active addresses is a crucial bullish indicator. These addresses shot up from near-zero on October 20 to 1,626 on October 30.
 [12.09.40, 30 Oct, 2020]-637396480019620533.png)
Yearn.finance daily active addresses chart
The transaction volume metric highlights an upswing in the number of transactions on the network on October 29. It is essential to keep in mind the transaction volume is not entirely a trend indicator but helps point out periods of incoming volatility. The metric can be used side-by-side with other on-chain and technical indicators.
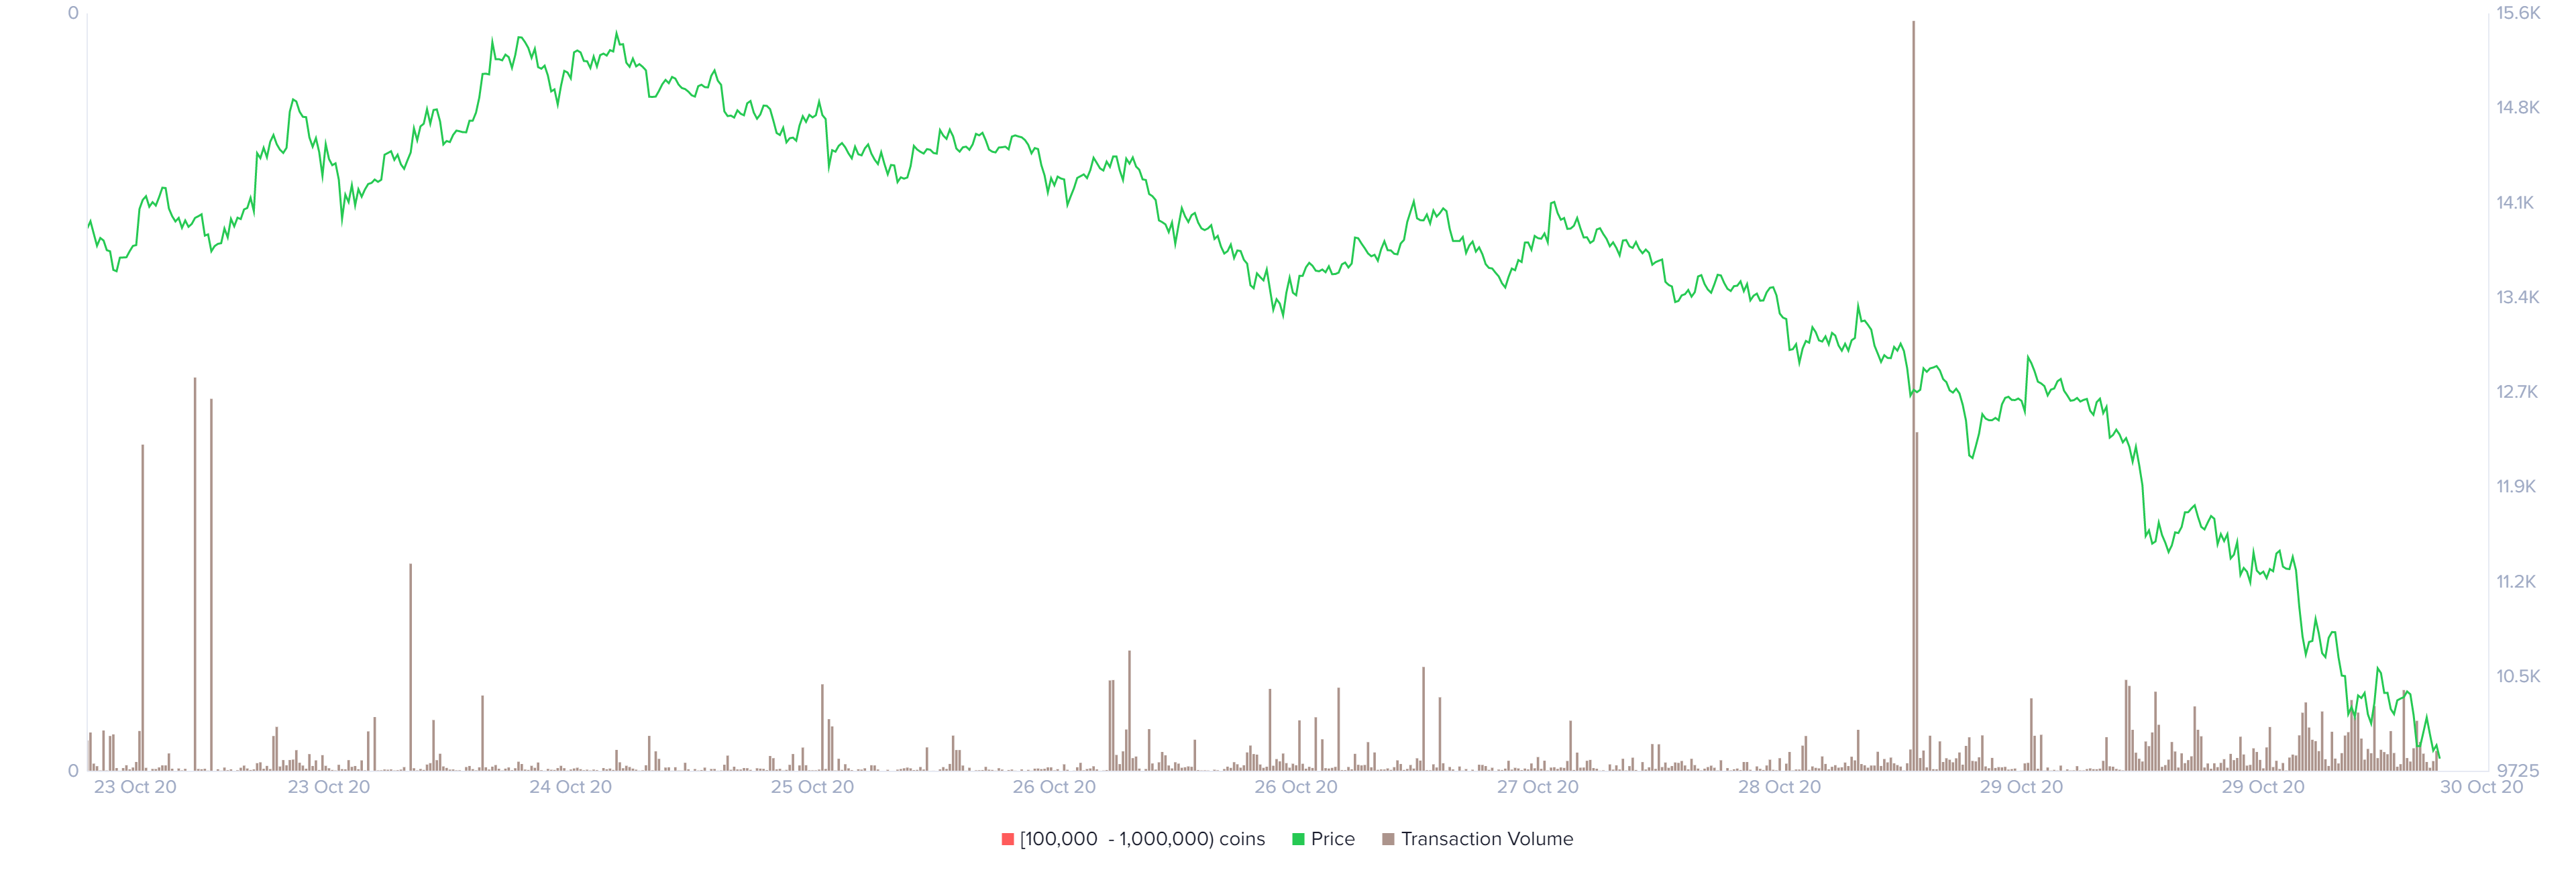
Yearn.finance transaction volume chart
Simultaneously, five whales holding between 1,000 and 10,000 YFI joined the network this week. The small entrance number of these large investors may seem insignificant, by their impact should not be underestimated, as they move a big volume of coins. If the addresses holding large amounts of YFI continue growing, a breakout in the price may soon come into play.
 [12.22.14, 30 Oct, 2020]-637396480788180928.png)
Yearn.finance holder distribution chart
The above on-chain metrics are a few that emphasize a possible reversal for YFI. According to Santiment, these bullish signs depict Ren's, which hit bottom sometime back and embarked on a recovery journey.
Looking at the other side of the picture
It is worth mentioning that technical levels present a contrary narrative to the one painted above. For instance, YFI/USD has dived below the middle boundary of a descending parallel channel, portraying an increasing seller grip.
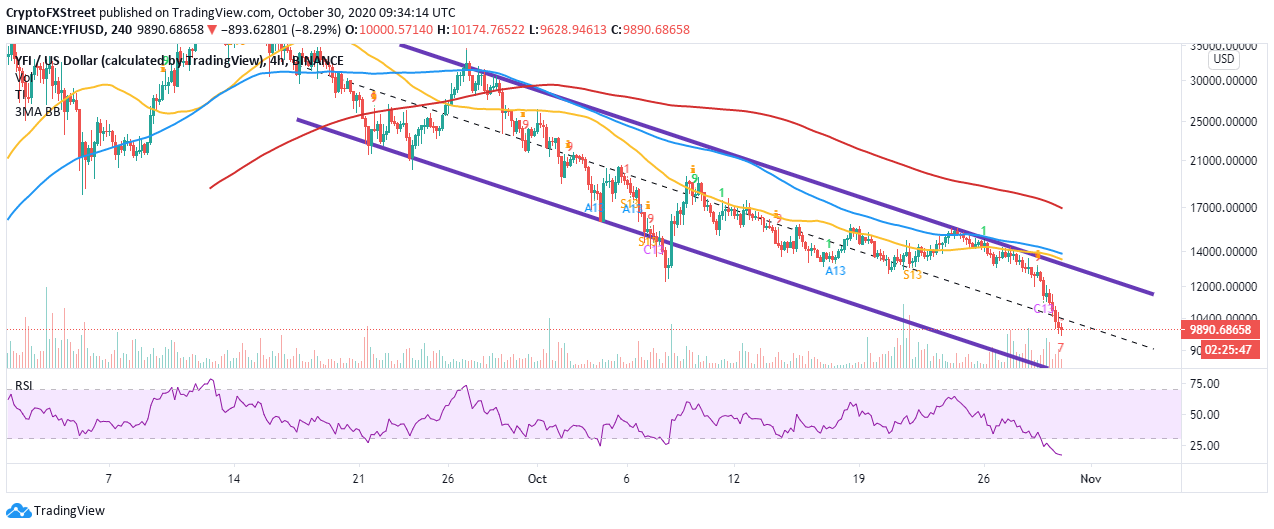
YFI/USD 4-hour chart
Simultaneously, the Relative Strength Index (RSI) suggests that bears have full control over the price. Therefore, YFI may incur some more losses before a bottom materializes to give way for recovery.
Information on these pages contains forward-looking statements that involve risks and uncertainties. Markets and instruments profiled on this page are for informational purposes only and should not in any way come across as a recommendation to buy or sell in these assets. You should do your own thorough research before making any investment decisions. FXStreet does not in any way guarantee that this information is free from mistakes, errors, or material misstatements. It also does not guarantee that this information is of a timely nature. Investing in Open Markets involves a great deal of risk, including the loss of all or a portion of your investment, as well as emotional distress. All risks, losses and costs associated with investing, including total loss of principal, are your responsibility. The views and opinions expressed in this article are those of the authors and do not necessarily reflect the official policy or position of FXStreet nor its advertisers. The author will not be held responsible for information that is found at the end of links posted on this page.
If not otherwise explicitly mentioned in the body of the article, at the time of writing, the author has no position in any stock mentioned in this article and no business relationship with any company mentioned. The author has not received compensation for writing this article, other than from FXStreet.
FXStreet and the author do not provide personalized recommendations. The author makes no representations as to the accuracy, completeness, or suitability of this information. FXStreet and the author will not be liable for any errors, omissions or any losses, injuries or damages arising from this information and its display or use. Errors and omissions excepted.
The author and FXStreet are not registered investment advisors and nothing in this article is intended to be investment advice.
Recommended Content
Editors’ Picks

IRS says crypto staking should be taxed in response to lawsuit
The IRS stated that rewards from cryptocurrency staking are taxable upon receipt, according to a Bloomberg report on Monday, which stated the agency rejected a legal argument that sought to delay taxation until such rewards are sold or exchanged.
Solana dominates Bitcoin, Ethereum in price performance and trading volume: Glassnode
Solana is up 6% on Monday following a Glassnode report indicating that SOL has seen more capital increase than Bitcoin and Ethereum. Despite the large gains suggesting a relatively heated market, SOL could still stretch its growth before establishing a top for the cycle.
Ethereum Price Forecast: ETH risks a decline to $3,000 as investors realize increased profits and losses
Ethereum is up 4% on Monday despite increased selling pressure across long-term and short-term holders in the past two days. If whales fail to maintain their recent buy-the-dip attitude, ETH risks a decline below $3,000.

Crypto Today: BTC hits new Trump-era low as Chainlink, HBAR and AAVE lead market recovery
The global cryptocurrency market cap shrank by $500 billion after the Federal Reserve's hawkish statements on December 17. Amid the market crash, Bitcoin price declined 7.2% last week, recording its first weekly timeframe loss since Donald Trump’s re-election.

Bitcoin: 2025 outlook brightens on expectations of US pro-crypto policy
Bitcoin price has surged more than 140% in 2024, reaching the $100K milestone in early December. The rally was driven by the launch of Bitcoin Spot ETFs in January and the reduced supply following the fourth halving event in April.

Best Forex Brokers with Low Spreads
VERIFIED Low spreads are crucial for reducing trading costs. Explore top Forex brokers offering competitive spreads and high leverage. Compare options for EUR/USD, GBP/USD, USD/JPY, and Gold.