![]() Lorenzo Stroe
Lorenzo Stroe
Independent Analyst
- YFI was down 72% since its peak at $43,966 but is showing signs of a reversal.
- The digital asset is currently trading at $18,439 after establishing a low at $12,260.
YFI is one of the most popular DeFi projects, overtaking Bitcoin in price, but not in market capitalization, which reached $1.2 billion at its peak.
Several indicators are showing YFI is ready for a bounce
On the daily chart, the bounce seems to be underway already after a low at $12,260.
YFI/USD daily chart
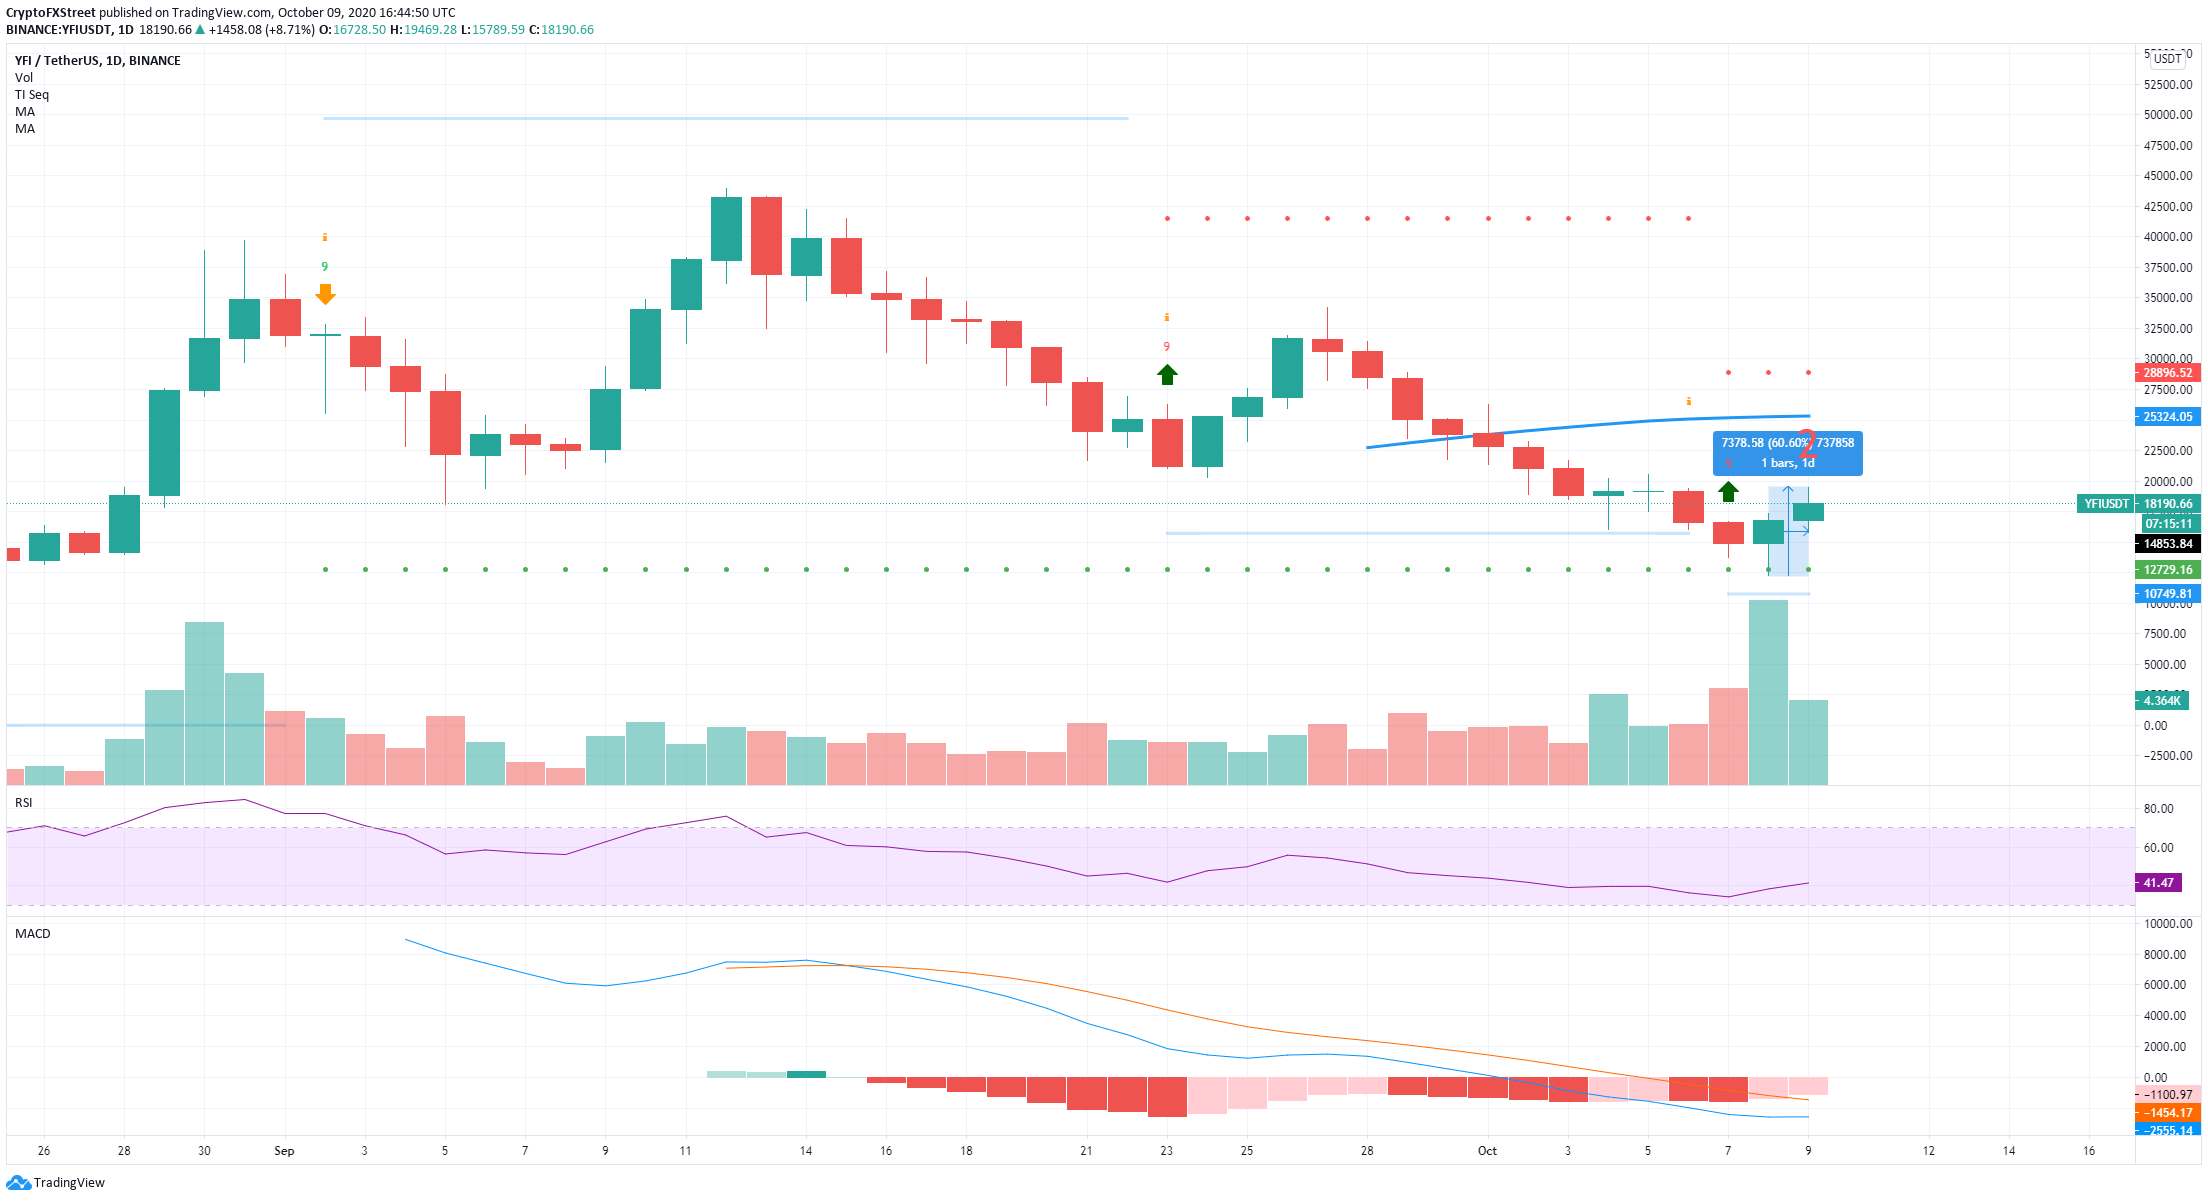
The TD sequential indicator presented a buy signal on October 7, which seems to have been validated over the next two days with a 60% bounce from YFI. The MACD is closer to a bullish cross, but not quite yet there.
YFI Open Interest Chart
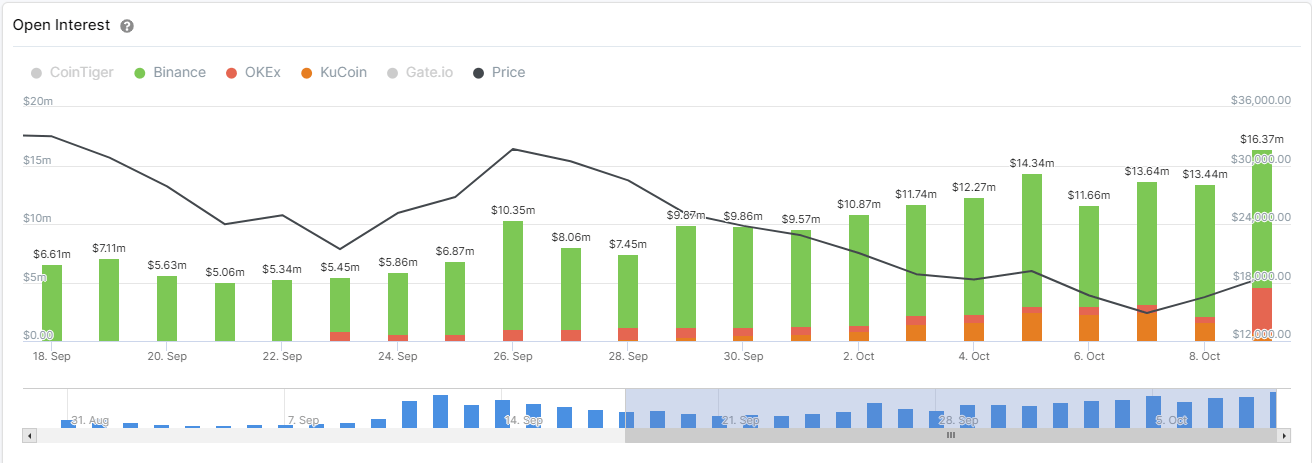
The average open interest of YFI on major exchanges like Binance, KuCoin, and OKEx, has increased significantly over the past 15 days. This metric represents the dollar amount of open positions and indicates that bulls are picking up steam.
YFI Number of Large Transactions
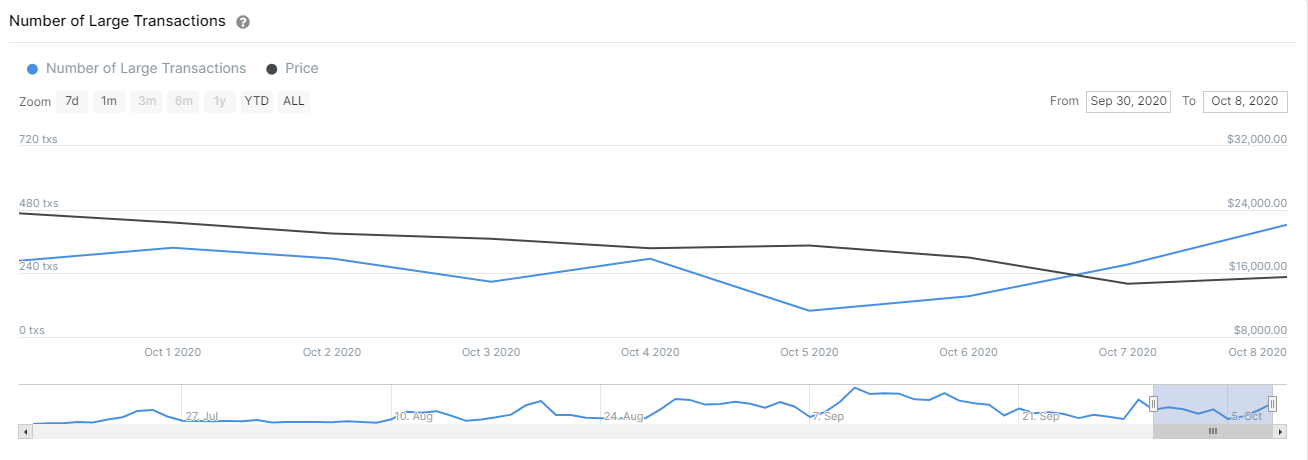
Using the chart provided by IntoTheBlock, we can observe a notable rise from a low of 99 transactions with a value of $100,000 or greater on October 5, to 423 transactions currently. Although an increase in large transactions doesn’t necessarily represent a bullish outlook, we can assume that most transactions were positive because of the rise in prices.
YFI/USD 1-hour chart
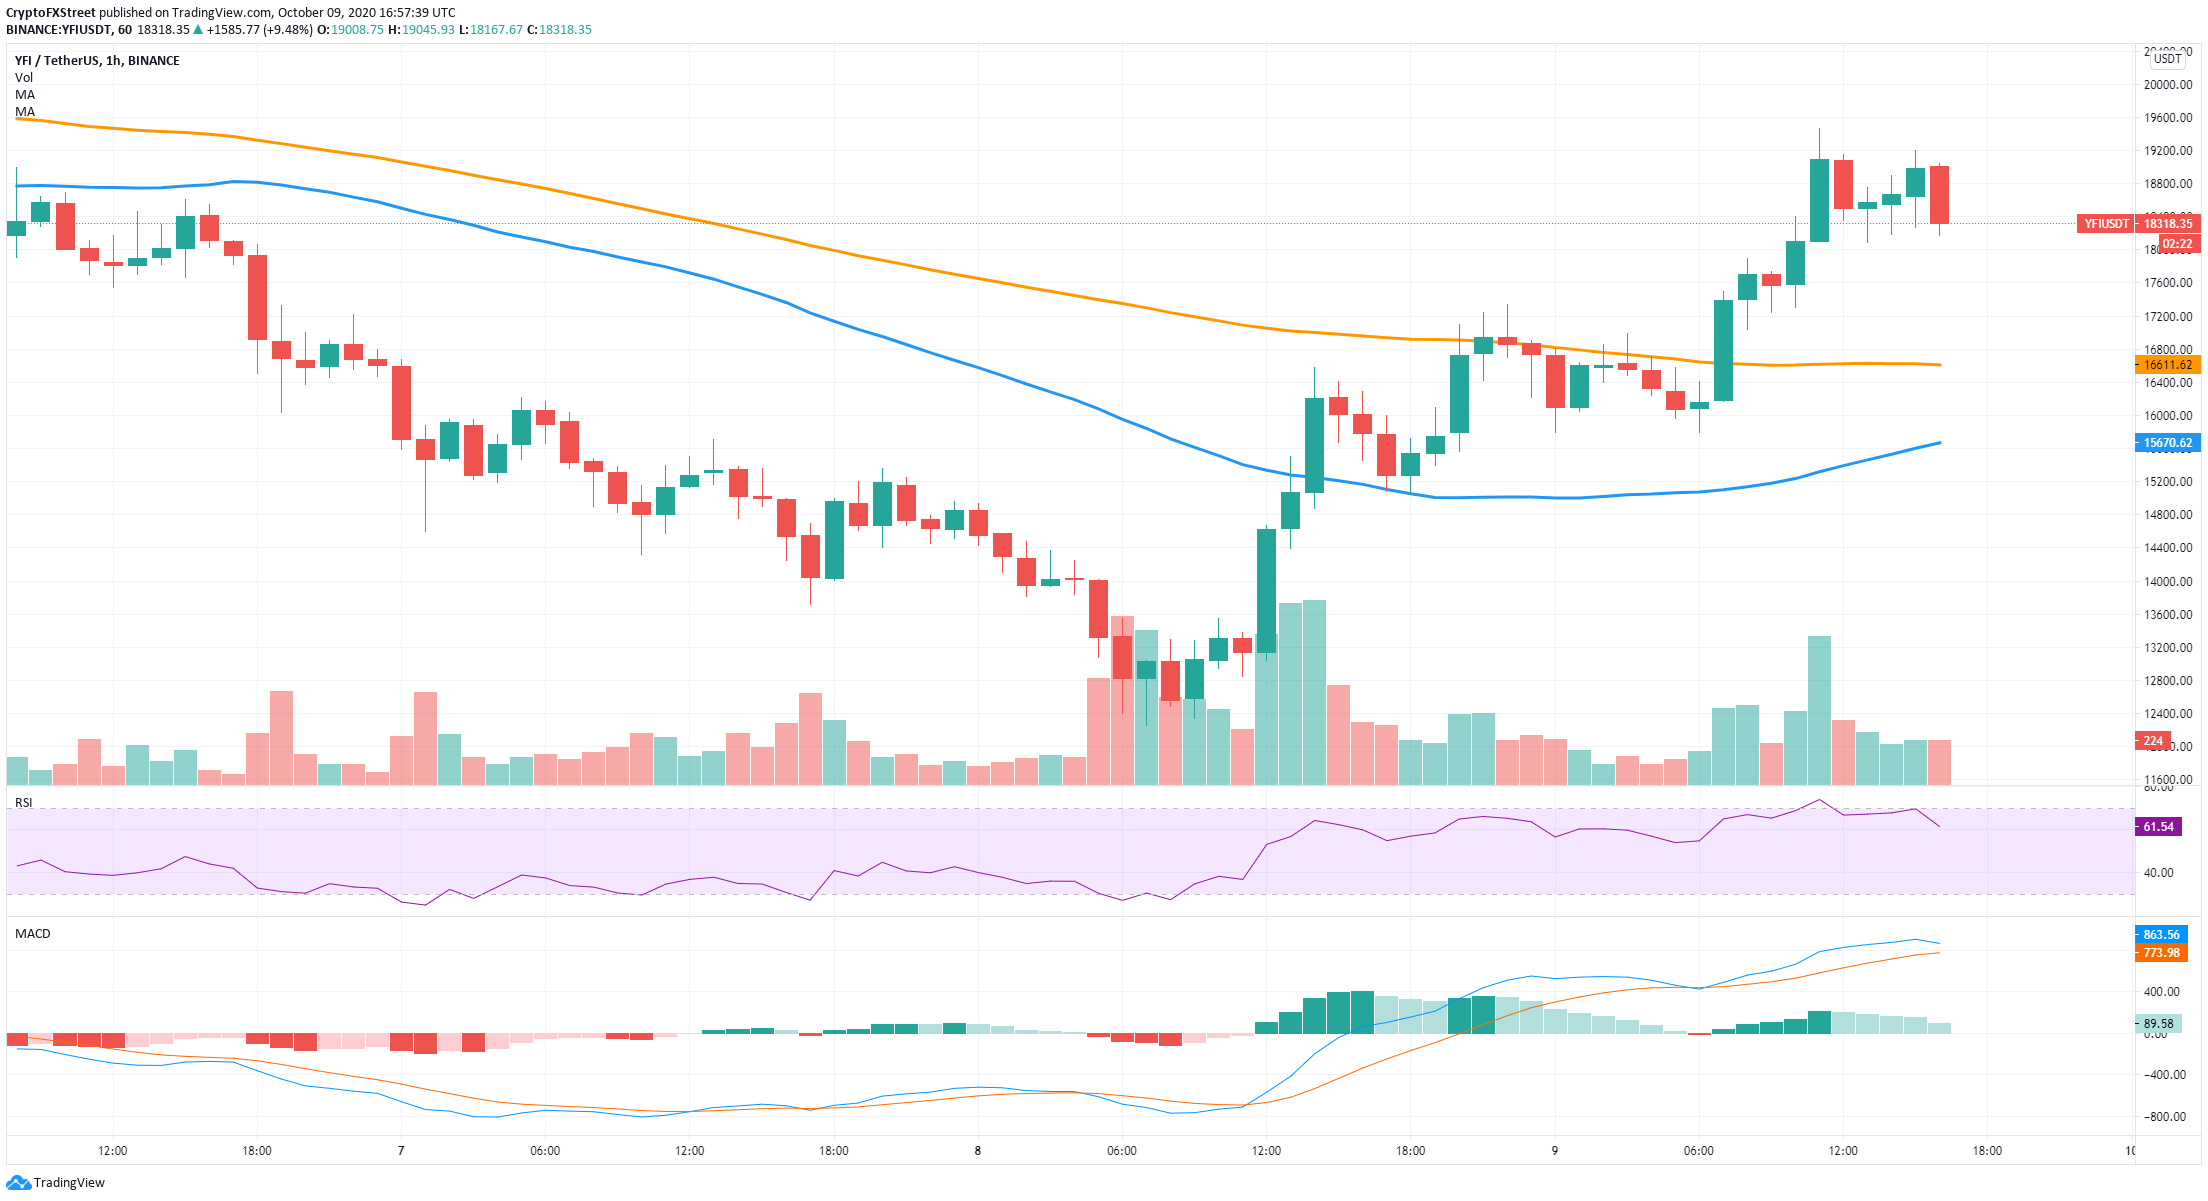
The hourly chart also flipped in favor of the bulls after climbing above the 50-SMA and then the 100-SMA and turning both into support levels. YFI has confirmed an hourly uptrend after establishing several higher highs and higher lows.
The next target price would be the psychological $20,000 level, followed by the 50-SMA on the daily chart at $25,000.
This rejection could slow down YFI bulls
However, looking at the 4-hour chart, we see that YFI is struggling to stay above the 50-SMA.
YFI/USD 4-hour chart
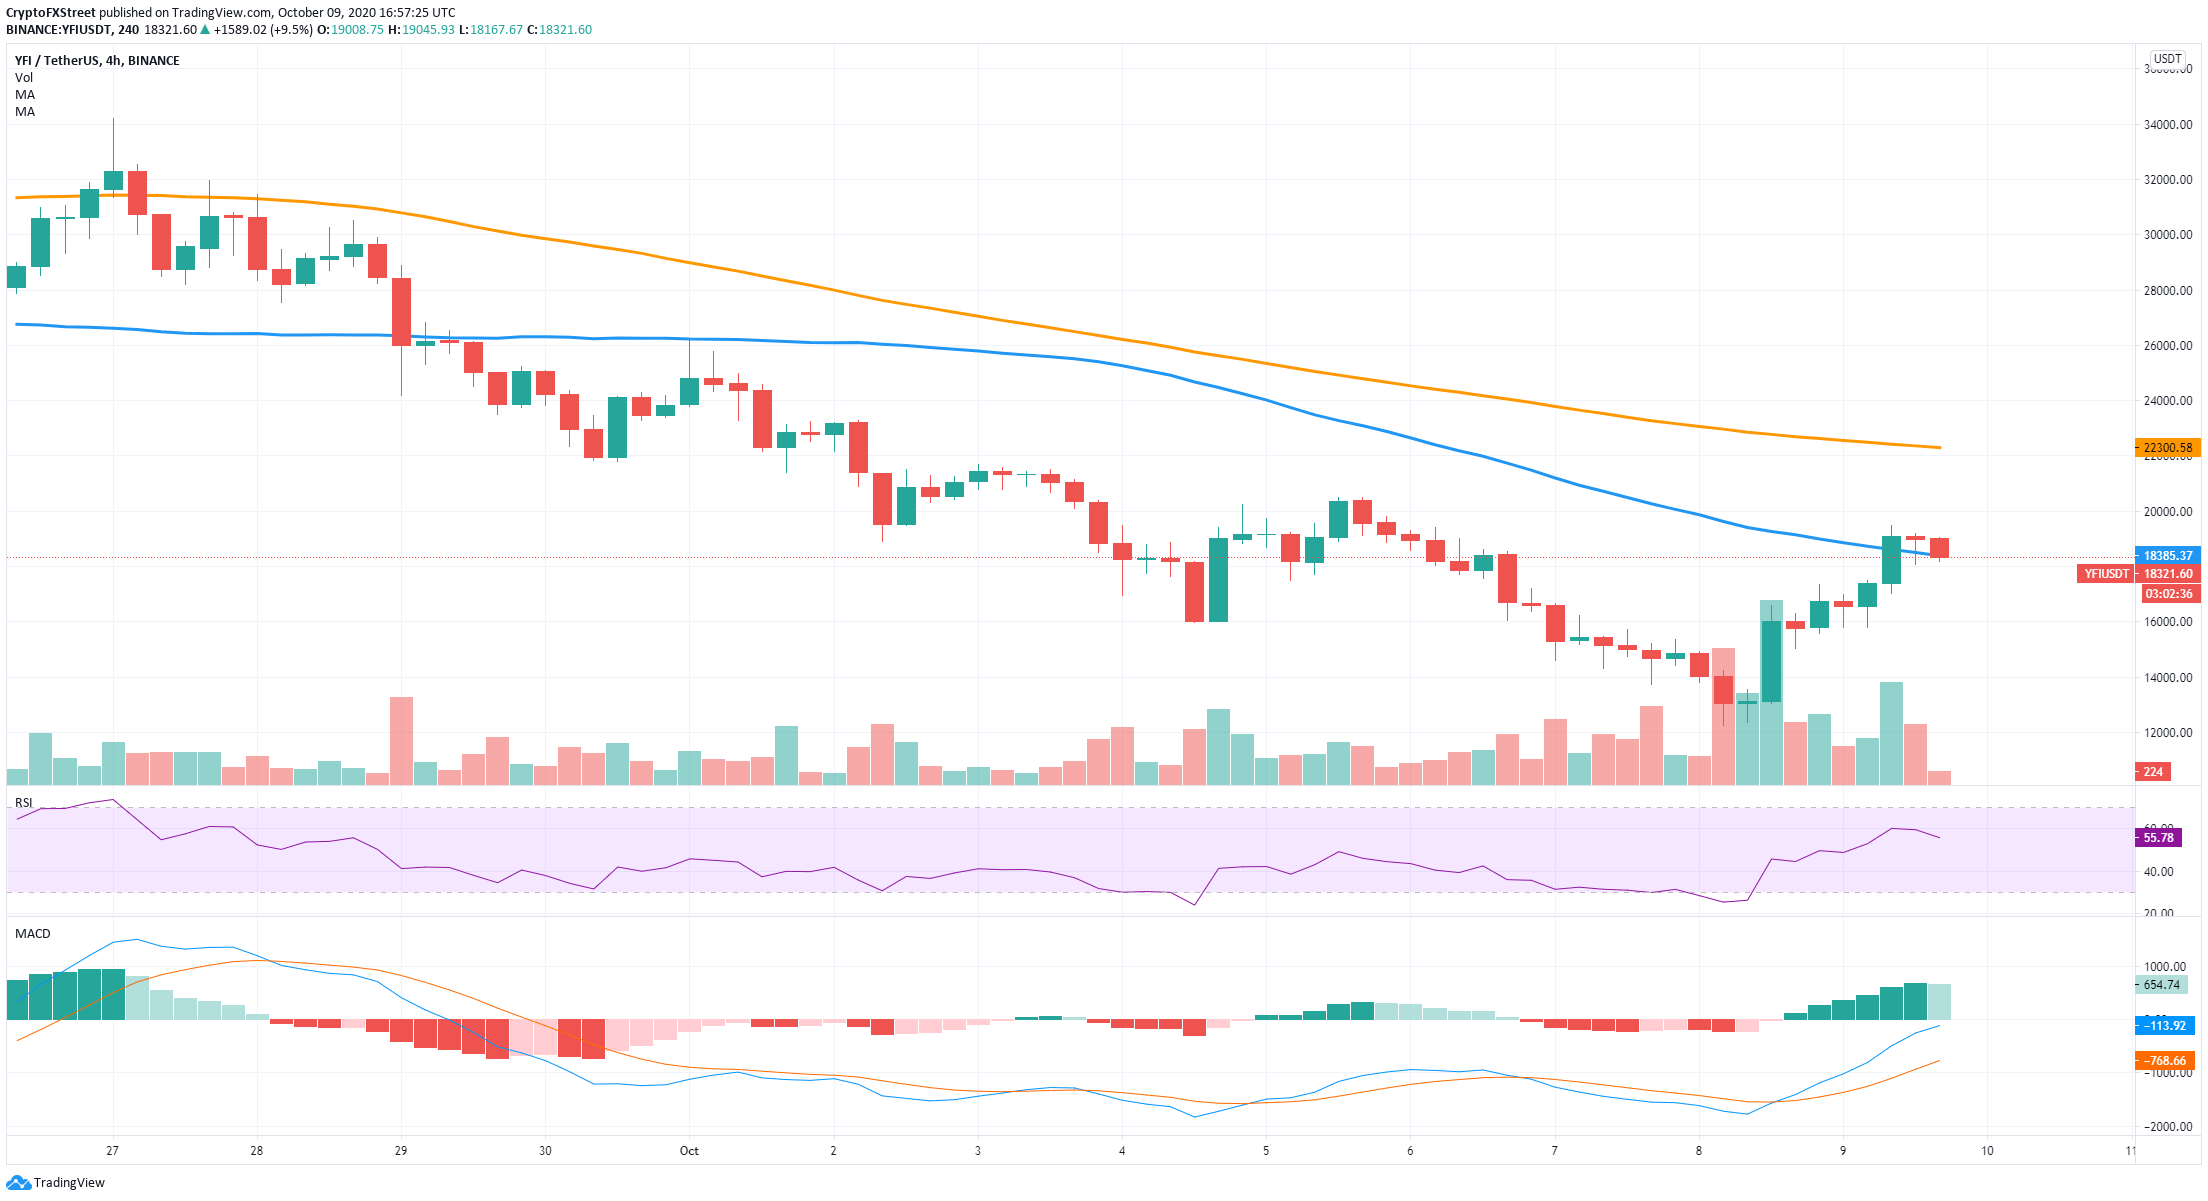
A rejection from $18,384 at the 50-SMA would be notable and likely to push YFI down, at least in the short-term.
YFI New Addresses
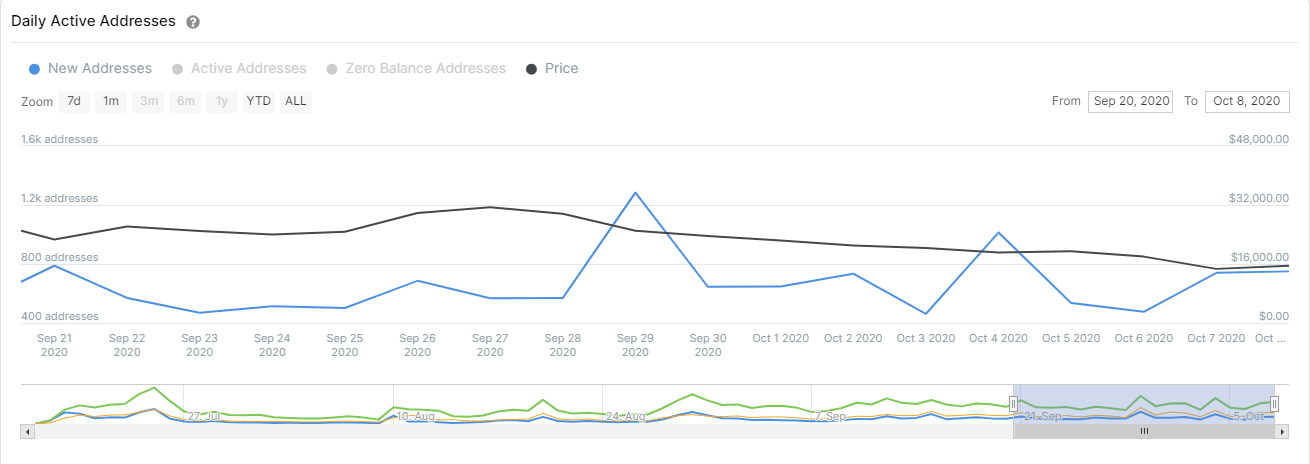
Furthermore, the number of new addresses joining the YFI network is not increasing. The peak of 1,280 on September 29 was followed by a lower high with 1,000 addresses on October 4 and only 750 currently.
This downtrend means that new investors are not particularly interested in YFI, even after the most recent bounce. The rejection of the 4-hour 50-SMA has the potential to push the digital asset down to $15,000.
Buyers need to look out for a clear breakout above the same level to eye up $20,000 and eventually $25,000, where the 50-SMA on the daily chart is established.
Note: All information on this page is subject to change. The use of this website constitutes acceptance of our user agreement. Please read our privacy policy and legal disclaimer. Opinions expressed at FXstreet.com are those of the individual authors and do not necessarily represent the opinion of FXstreet.com or its management. Risk Disclosure: Trading foreign exchange on margin carries a high level of risk, and may not be suitable for all investors. The high degree of leverage can work against you as well as for you. Before deciding to invest in foreign exchange you should carefully consider your investment objectives, level of experience, and risk appetite. The possibility exists that you could sustain a loss of some or all of your initial investment and therefore you should not invest money that you cannot afford to lose. You should be aware of all the risks associated with foreign exchange trading, and seek advice from an independent financial advisor if you have any doubts.
Recommended Content
Editors’ Picks

Bitcoin Weekly Forecast: BTC nosedives below $95,000 as spot ETFs record highest daily outflow since launch
Bitcoin price continues to edge down, trading below $95,000 on Friday after declining more than 9% this week. Bitcoin US spot ETFs recorded the highest single-day outflow on Thursday since their launch in January.

Bitcoin crashes to $96,000, altcoins bleed: Top trades for sidelined buyers
Bitcoin (BTC) slipped under the $100,000 milestone and touched the $96,000 level briefly on Friday, a sharp decline that has also hit hard prices of other altcoins and particularly meme coins.

Solana Price Forecast: SOL’s technical outlook and on-chain metrics hint at a double-digit correction
Solana (SOL) price trades in red below $194 on Friday after declining more than 13% this week. The recent downturn has led to $38 million in total liquidations, with over $33 million coming from long positions.

SEC approves Hashdex and Franklin Templeton's combined Bitcoin and Ethereum crypto index ETFs
The SEC approved Hashdex's proposal for a crypto index ETF. The ETF currently features Bitcoin and Ethereum, with possible additions in the future. The agency also approved Franklin Templeton's amendment to its Cboe BZX for a crypto index ETF.

Bitcoin: 2025 outlook brightens on expectations of US pro-crypto policy
Bitcoin (BTC) price has surged more than 140% in 2024, reaching the $100K milestone in early December. The rally was driven by the launch of Bitcoin Spot Exchange Traded Funds (ETFs) in January and the reduced supply following the fourth halving event in April.

Best Forex Brokers with Low Spreads
VERIFIED Low spreads are crucial for reducing trading costs. Explore top Forex brokers offering competitive spreads and high leverage. Compare options for EUR/USD, GBP/USD, USD/JPY, and Gold.