- Yearn.Finance stalls under $24,000, but most technical and on-chain indexes point towards a breakout.
- YFI/USD must hold the ground $20,000 to ensure that bulls do not lose focus of the anticipated rally to $28,000.
Yearn.Finance's upward momentum has consistently developed since a bottom was called at $8,000. The decentralized (YFI) token is likely to lift off to $28,000 as long as the crucial hurdle is shattered at $24,000.
Yearn.Finance holds at the threshold as $28,000 beckons
YFI is still the most expensive cryptocurrency token in the market, despite Bitcoin rallying towards $18,000. The rebound from the bottom at $8,000 has been progressive so that barriers are frequently flipped into support levels.
At the time of writing, Yearn.Finance is trading at $23,510 while dealing with the selling pressure at $24,000. The crypto is trading above all the three simple moving averages; the 50 SMA, 100 SMA, and 200 SMA. In other words, the least resistance path is upwards, even ignoring the overbought condition as highlighted by the Relative Strength Index.
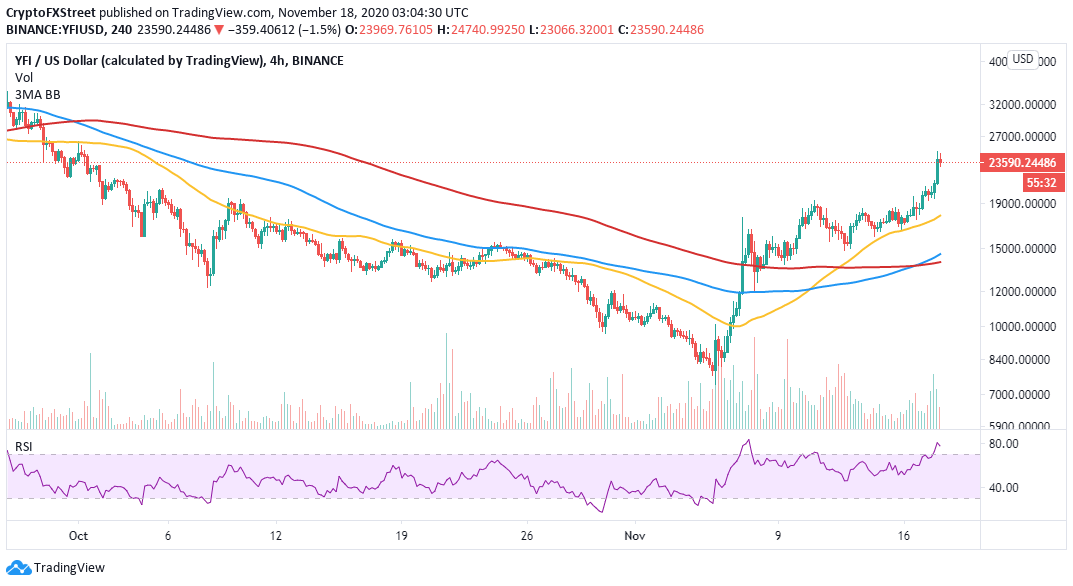
YFI/USD 4-hour chart
According to the 4-hour chart, the TD Sequential indicator's multiple sell signals have been invalidated in the last two weeks. Sell signals take the form of green nine candlesticks. When invalidated, the price tends to rally some more before another signal is flashed. For instance, a recent sell signal was ignored as YFI spiked further, hitting $24,944.
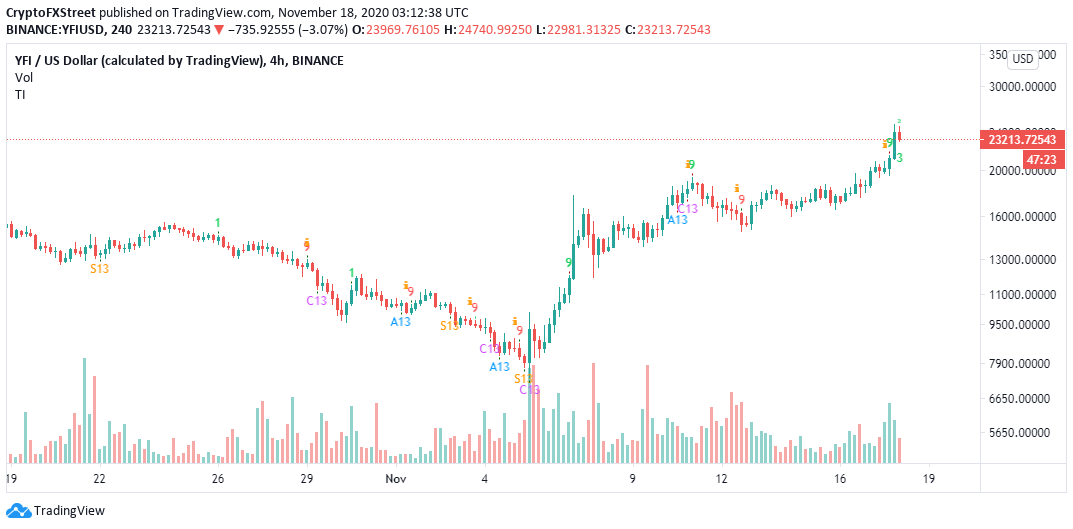
YFI/USD 4-hour chart
IntoTheBlock's "Daily New Addresses" metric printed a bullish pattern from November 14 when 338 new addresses joined the platform. At the time of writing, the newly created addresses on the network have more than doubled to 770. In other words, YFI adoption is on an impressive uptrend, which is also a bullish signal for the value of the token and validates the bullish outlook.
-637412677605267389.png)
YFI daily new addresses chart
The IOMAP model by IntoTheBlock reveals that YFI is ready to take off towards $28,000 if the medium-strong resistance between $24,575 and $25,255 is broken. Here, 321 addresses are holding nearly 331 YFI.
-637412677152112261.png)
Yearn.finance IOMAP chart
On the downside, it worth noting that bears have some room to play before YFI finds credible support. The model above highlights robust support between $19,682 and $20,405. Here, 824 addresses had previously bought approximately 1,500 YFI. Therefore, buyers must push the price above $24,000 to ensure that extended losses are averted.
Information on these pages contains forward-looking statements that involve risks and uncertainties. Markets and instruments profiled on this page are for informational purposes only and should not in any way come across as a recommendation to buy or sell in these assets. You should do your own thorough research before making any investment decisions. FXStreet does not in any way guarantee that this information is free from mistakes, errors, or material misstatements. It also does not guarantee that this information is of a timely nature. Investing in Open Markets involves a great deal of risk, including the loss of all or a portion of your investment, as well as emotional distress. All risks, losses and costs associated with investing, including total loss of principal, are your responsibility. The views and opinions expressed in this article are those of the authors and do not necessarily reflect the official policy or position of FXStreet nor its advertisers. The author will not be held responsible for information that is found at the end of links posted on this page.
If not otherwise explicitly mentioned in the body of the article, at the time of writing, the author has no position in any stock mentioned in this article and no business relationship with any company mentioned. The author has not received compensation for writing this article, other than from FXStreet.
FXStreet and the author do not provide personalized recommendations. The author makes no representations as to the accuracy, completeness, or suitability of this information. FXStreet and the author will not be liable for any errors, omissions or any losses, injuries or damages arising from this information and its display or use. Errors and omissions excepted.
The author and FXStreet are not registered investment advisors and nothing in this article is intended to be investment advice.
Recommended Content
Editors’ Picks

Bitcoin, Ethereum and XRP steady as China slaps 125% tariff on US, weekend sell-off looming?
The Cryptocurrency market shows stability at the time of writing on Friday, with Bitcoin (BTC) holding steady at $82,584, Ethereum (ETH) at $1,569, and Ripple (XRP) maintaining its position above $2.00.

Bitcoin Weekly Forecast: Market uncertainty lingers, Trump’s 90-day tariff pause sparks modest recovery
Bitcoin price extends recovery to around $82,500 on Friday after dumping to a new year-to-date low of $74,508 to start the week. Market uncertainty remains high, leading to a massive shakeout, with total liquidations hitting $2.18 billion across crypto markets.

Bitcoin, Ethereum, Dogecoin and Cardano stabilze – Why crypto is in limbo
Bitcoin, Ethereum, Dogecoin and Cardano stabilize on Friday as crypto market capitalization steadies around $2.69 trillion. Crypto traders are recovering from the swing in token prices and the Monday bloodbath.

Can FTX’s 186,000 unstaked SOL dampen Solana price breakout hopes?
Solana price edges higher and trades at $117.31 at the time of writing on Friday, marking a 3.4% increase from the $112.80 open. The smart contracts token corrected lower the previous day, following a sharp recovery to $120 induced by US President Donald Trump’s 90-day tariff pause on Wednesday.
Bitcoin Weekly Forecast: Market uncertainty lingers, Trump’s 90-day tariff pause sparks modest recovery
Bitcoin (BTC) price extends recovery to around $82,500 on Friday after dumping to a new year-to-date low of $74,508 to start the week. Market uncertainty remains high, leading to a massive shakeout, with total liquidations hitting $2.18 billion across crypto markets.

The Best brokers to trade EUR/USD
SPONSORED Discover the top brokers for trading EUR/USD in 2025. Our list features brokers with competitive spreads, fast execution, and powerful platforms. Whether you're a beginner or an expert, find the right partner to navigate the dynamic Forex market.