|

Yearn.Finance Price Forecast: YFI’s next buying opportunity may come at $18,000

  • Yearn.Finance price is trading inside a descending triangle on the 4-hour chart.
  • Several on-chain metrics have turned bearish in the past week, indicating that YFI is poised for a pullback. 

YFI had an astounding 290% bull rally that started on November 5 and peaked on November 20 at $29,890. The digital asset seems to be under consolidation, and many indicators are turning bearish in the past week. 

YFI needs to hold critical level to avoid a 23% pullback

On the 4-hour chart, Yearn.Finance price is trading at $22,459, just above the lower boundary of the descending triangle pattern formed. A breakdown from this point would most likely drive YFI price towards $17,500. 

yfi price

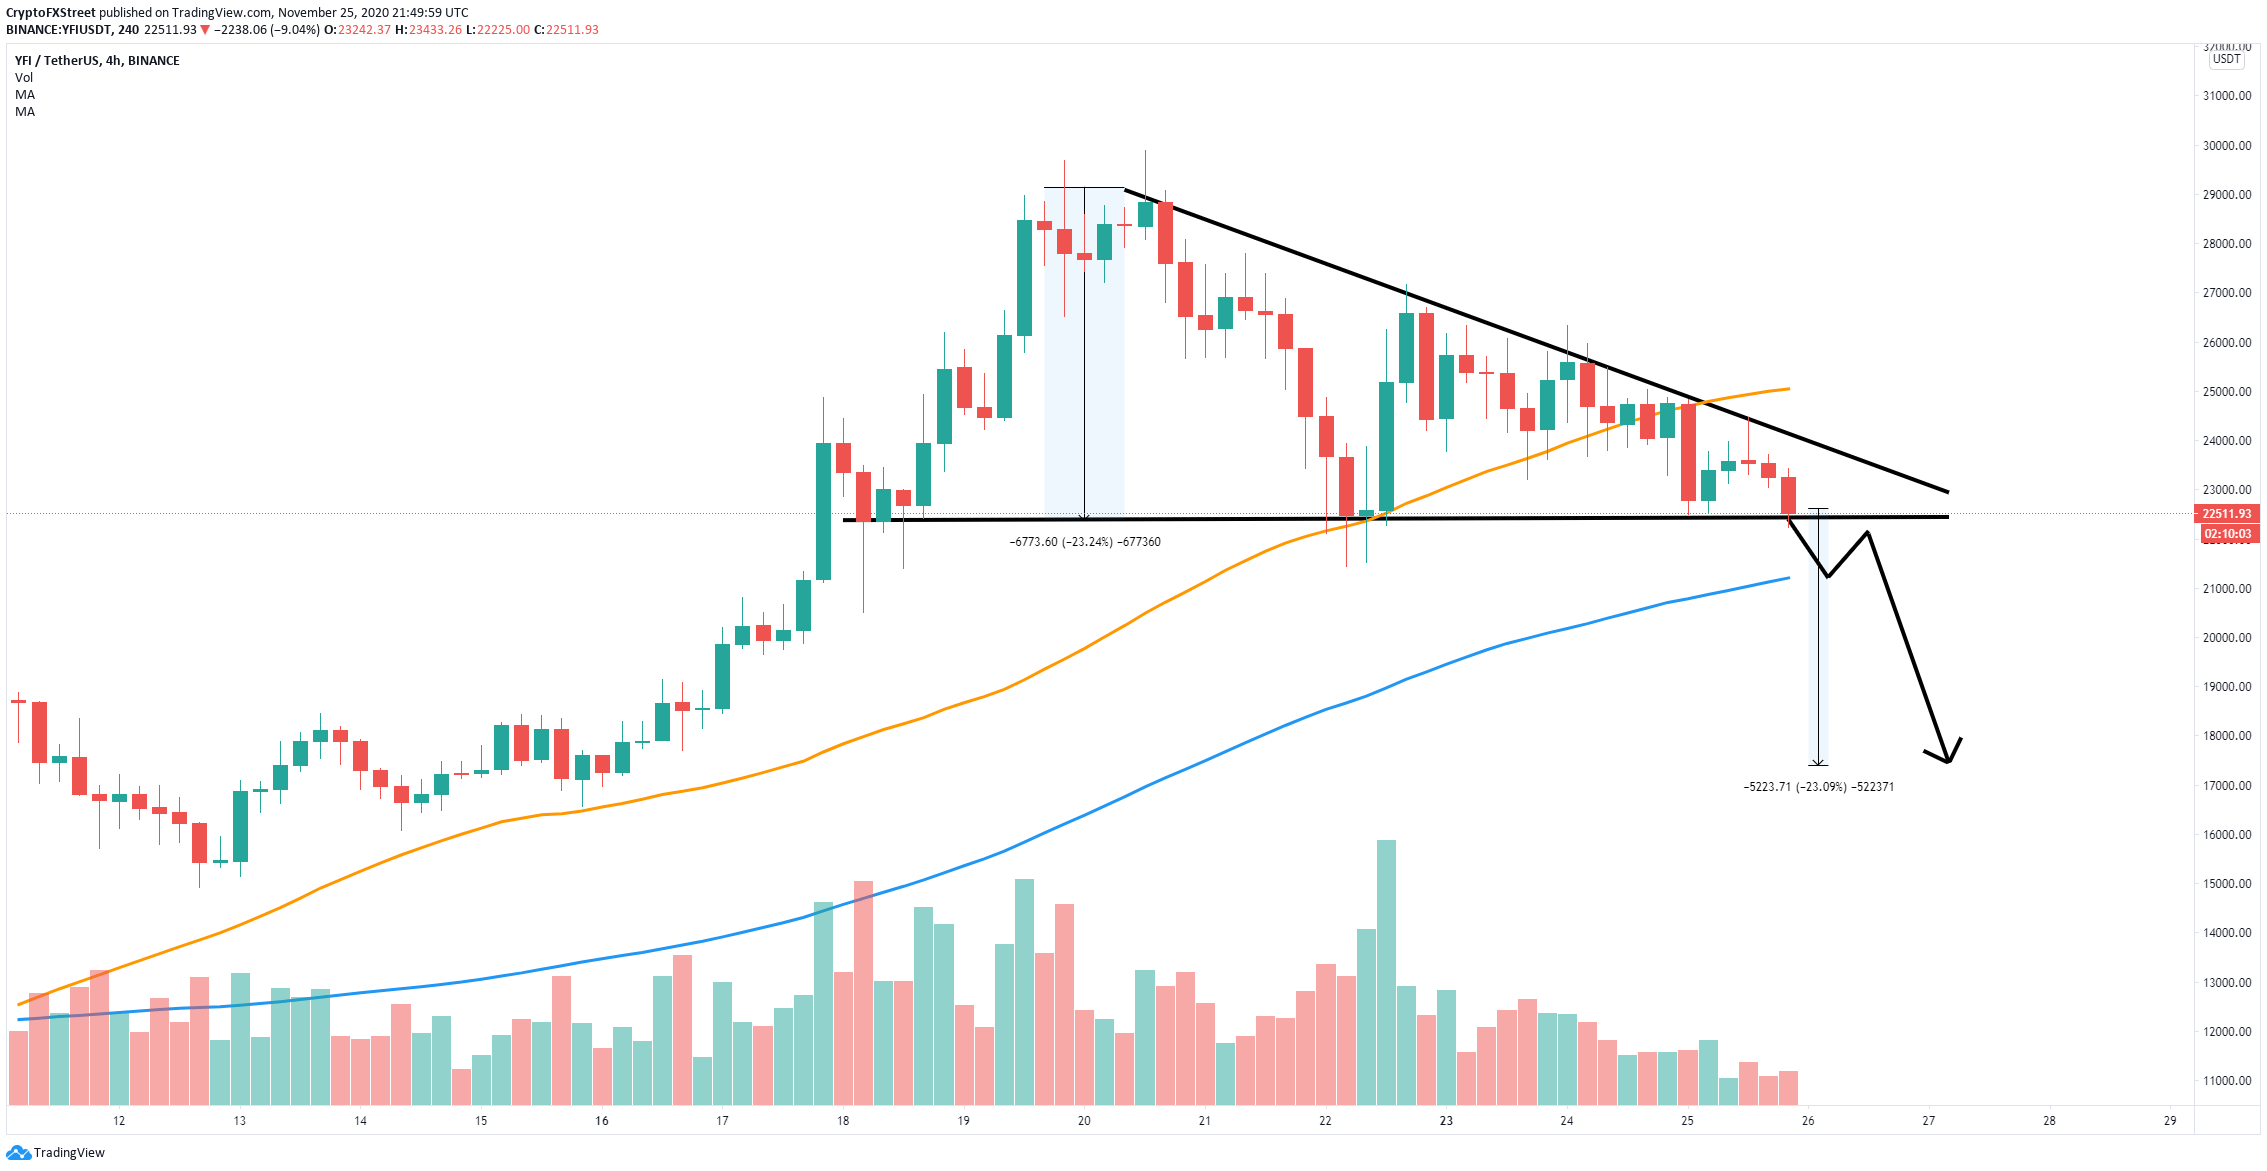
YFI/USD 4-hour chart

The bulls have lost the 50-SMA support level on November 25. If the support level at $22,459 fails to hold, the nearest price target would be the 100-SMA at $21,230, from which the price could potentially rebound towards the lower boundary of the channel as a re-test. 

yfi price

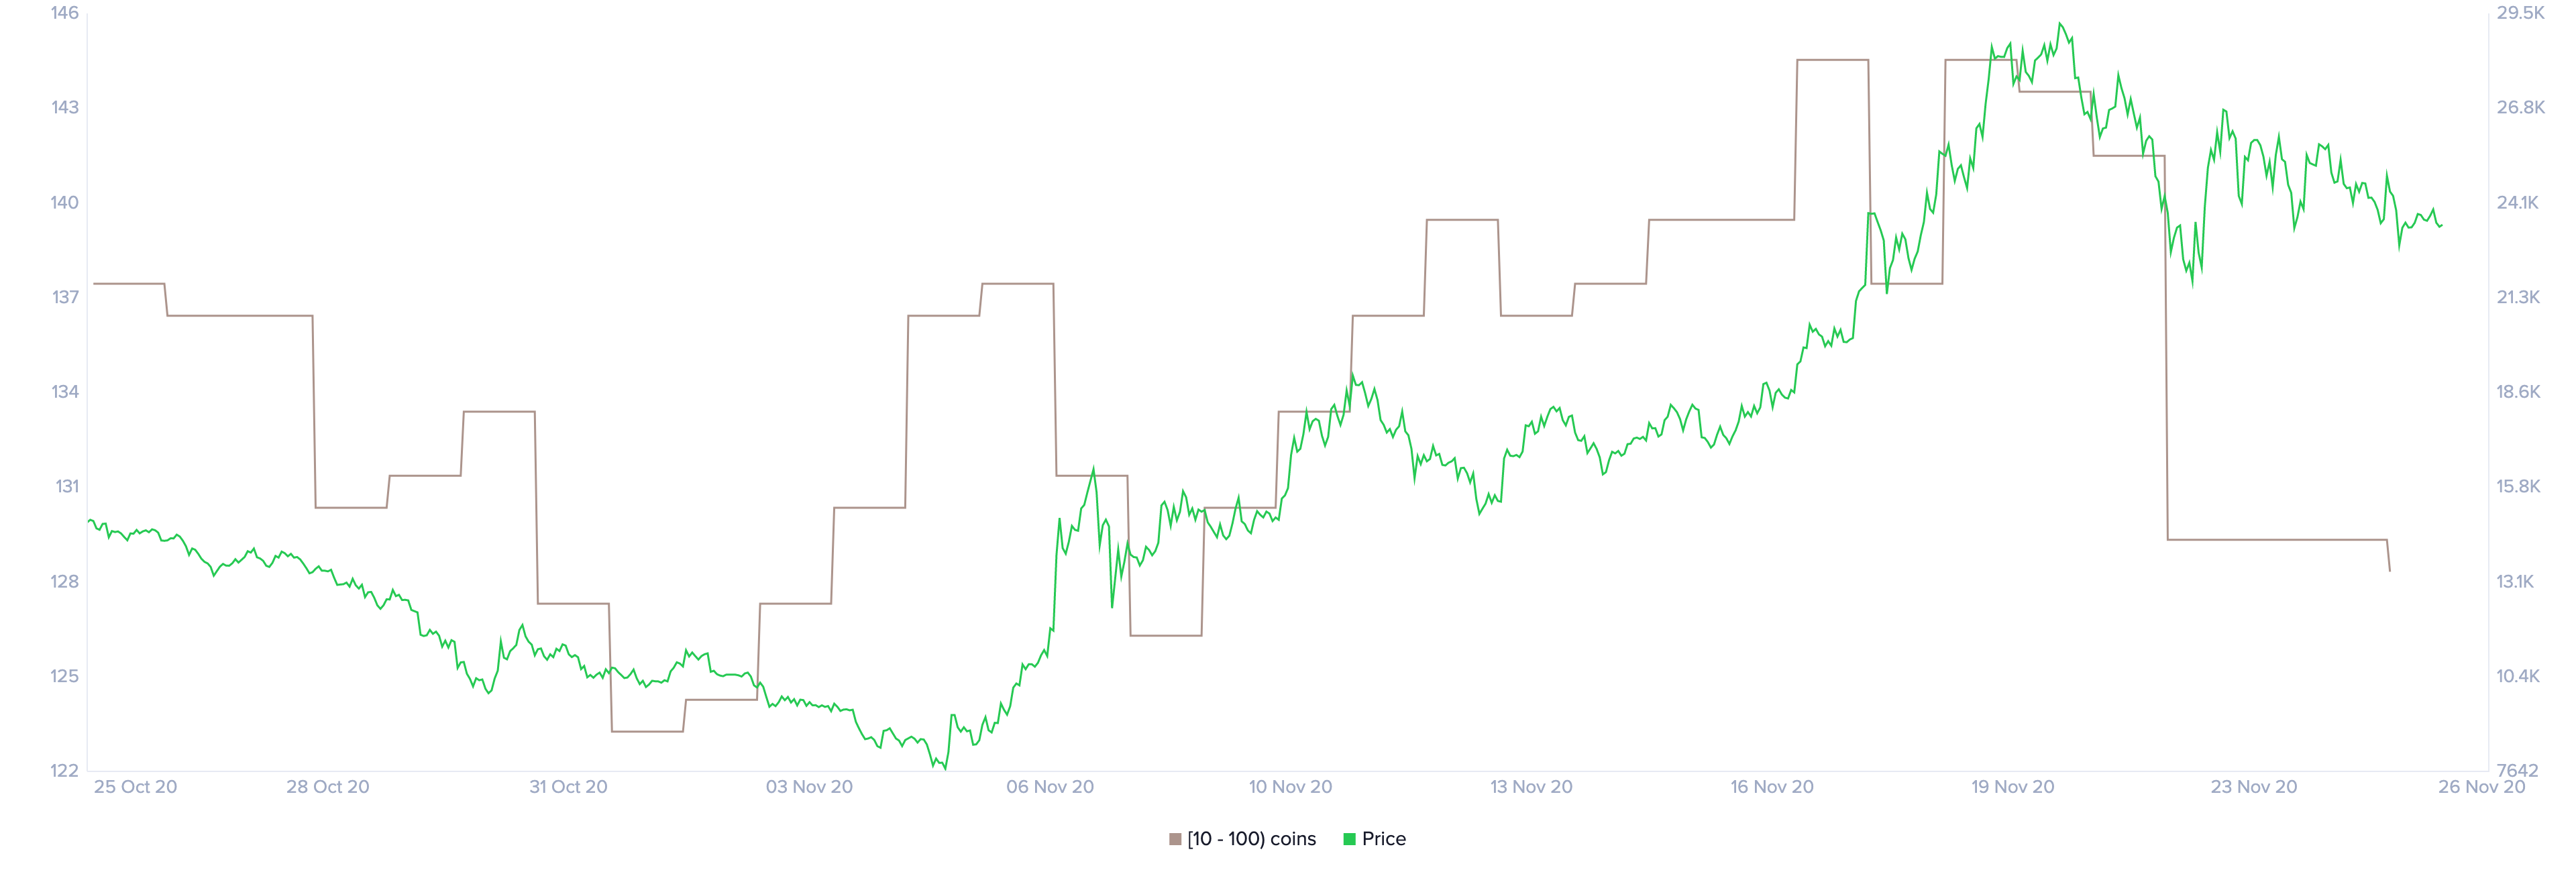
YFI Holders Distribution chart 

It also seems that YFI whales are dumping their coins. The holders distribution chart shows that the number of investors holding between 10 and 100 YFI coins ($240,00 and $2,400,000) has significantly dropped since November 16 from a high of 145 to a current low of 130. 

yfi price

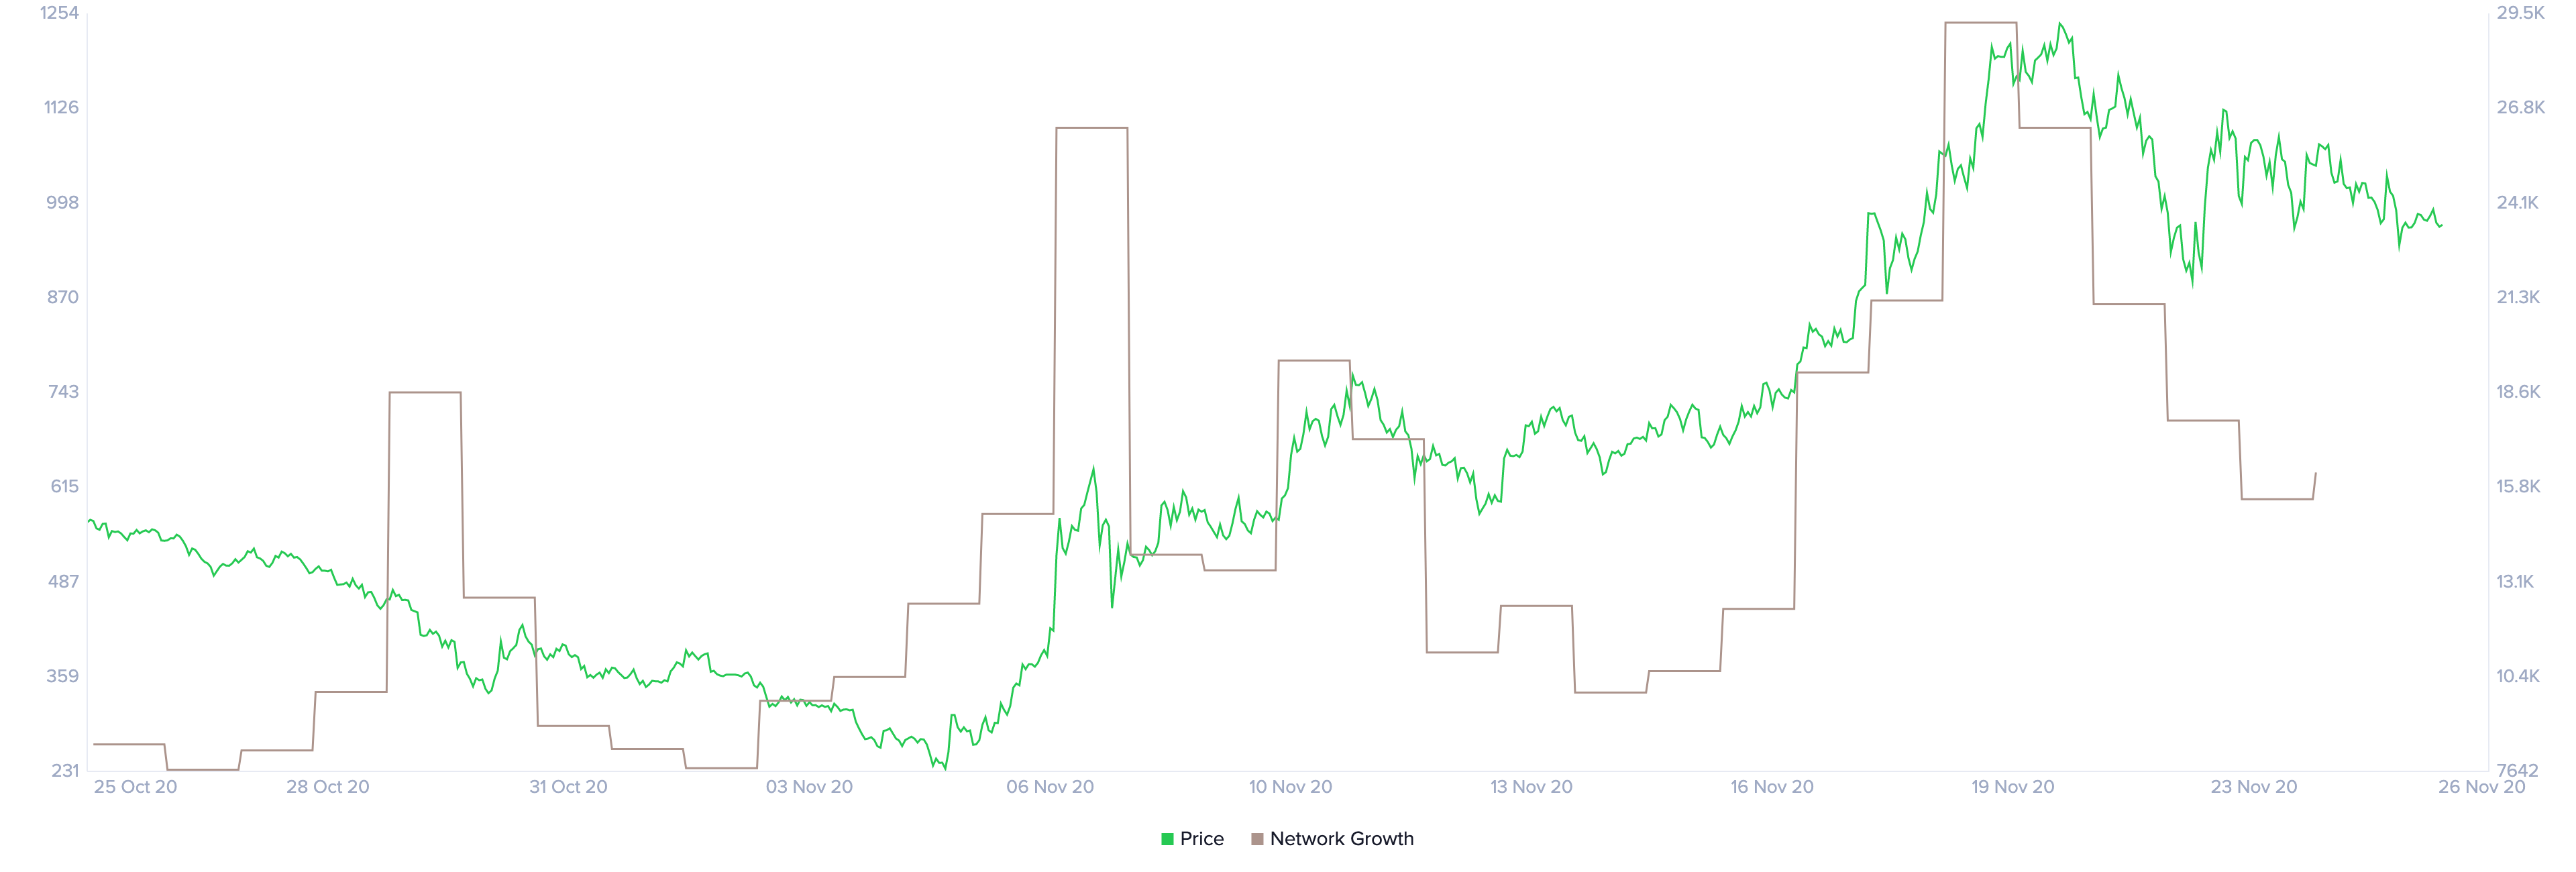
YFI Network Growth chart

Additionally, the network growth of YFI, which had a massive spike that started on November 16, is now declining significantly, which indicates the digital asset is weak and prone to price correction periods.

Author

Lorenzo Stroe

Lorenzo Stroe

Independent Analyst

Lorenzo is an experienced Technical Analyst and Content Writer who has been working in the cryptocurrency industry since 2012. He also has a passion for trading.

More from Lorenzo Stroe
Share:

Editor's Picks

Grass 20% bullish breakout defies broader market weakness

Grass (GRASS) is edging up above $0.30 at the time of writing on Monday. The token’s notable 20% intraday surge stands out amid heightened volatility in the broader crypto market.

XRP slides as US-Iran war weakens sentiment

Ripple remains under pressure, trading around $1.35 at the time of writing on Monday. The remittance token extended its down leg to $1.27 on Saturday after the US, in collaboration with Israel, launched attacks on Iran, killing the nation’s Supreme Leader, Ali Khamenei.

Crypto Today: Bitcoin pares losses, Ethereum and XRP drift lower as Middle East conflict pressures risk assets

Bitcoin, Ethereum and Ripple remain on edge as the Israel-US war on Iran risk-off sentiment. The Crypto King trades above $66,000 at the time of writing on Monday, but is struggling to break through the seller congestion around $67,000.

Bitcoin on brink of breakdown amid US-Iran war

Bitcoin (BTC) remains under pressure near the key support level of $65,700. Trading at $66,400 at the time of writing on Monday, a breakdown below this critical level would suggest a deeper correction ahead.

Bitcoin Price Annual Forecast: BTC holds long-term bullish structure heading into 2026

Bitcoin (BTC) is wrapping up 2025 as one of its most eventful years, defined by unprecedented institutional participation, major regulatory developments, and extreme price volatility.

Bitcoin: Another month of losses, and it’s been five

Bitcoin (BTC) price is stabilizing around $68,000 at the time of writing on Friday, but the Crypto King is poised to close February on a fragile footing, marking its fifth consecutive month of losses since October and a rare start to the year with back-to-back monthly corrections.