Yearn Finance faces a bull trap that will push YFI to $25,000
- Yearn Finance price faces an $8,500 drop to return to $25,000.
- Resistance within the Ichimoku system corroborates weakness on the Point and Figure chart.
- Upside potential does remain but is likely limited.

Yearn Finance price action is developing a particularly bearish chart pattern in the form of a head-and-shoulders pattern on its $250/3-box reversal Point and Figure chart, warning of a nearly 25% drop coming up.
Yearn Finance price to top out against crucial resistance levels and eyes a significant drop soon
Yearn Finance price has been stuck inside the Ichimoku Cloud on the daily chart since December 22. The range and bodies of those daily candlesticks have mostly been confined to the bounds of the top and bottom of the Cloud. Today, YFI is testing the top of the Cloud (Senkou Span B) at $33,750.
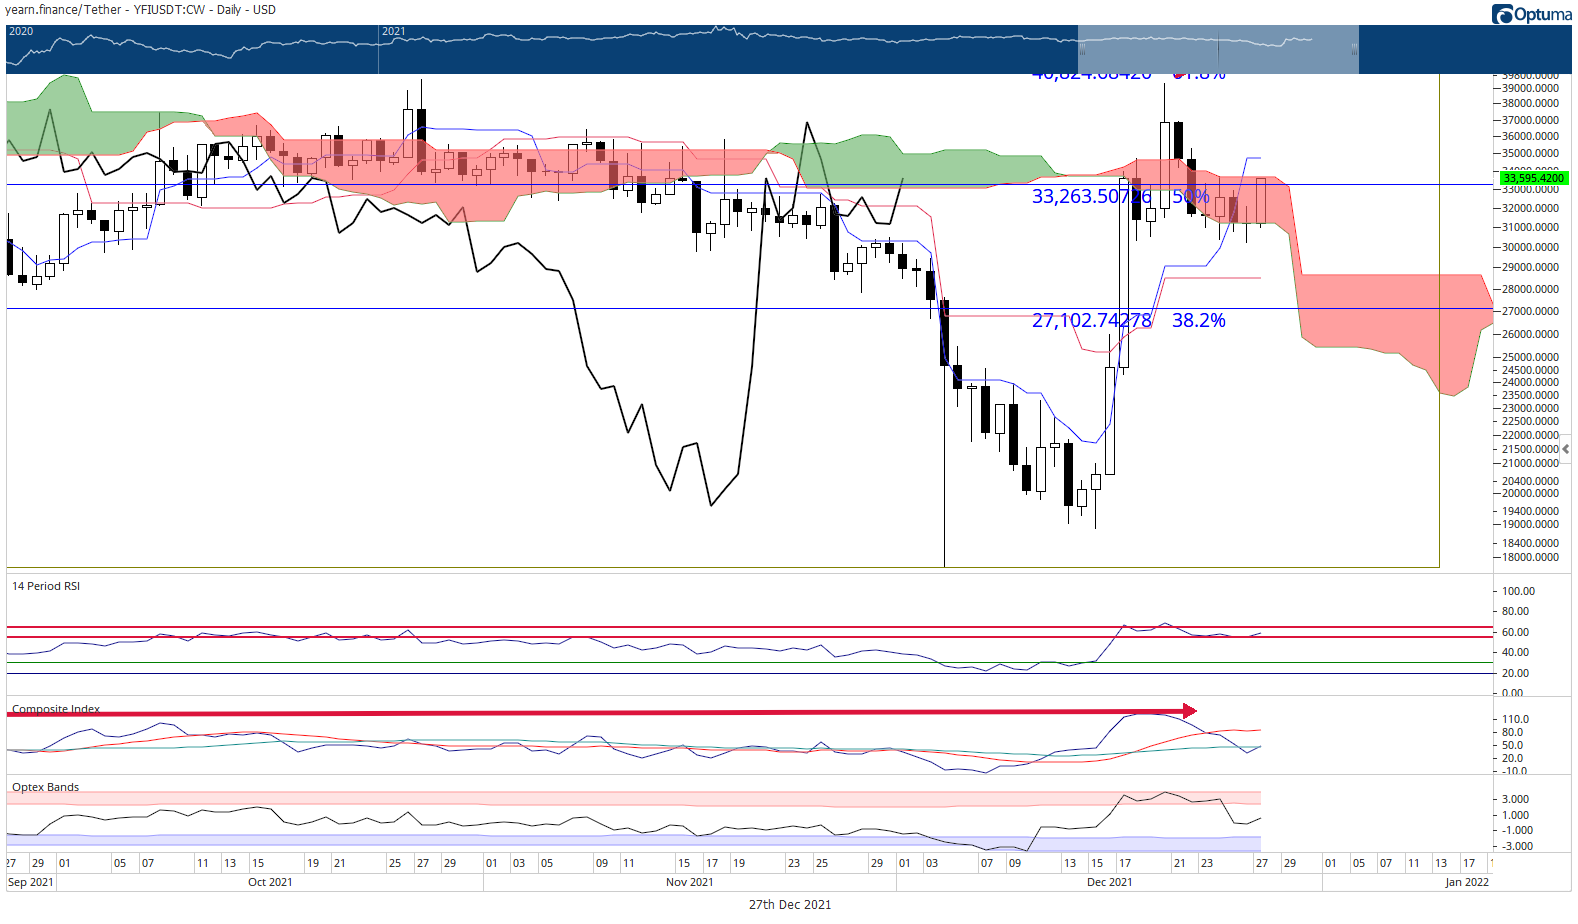
Bulls will likely face some difficulty pushing Yearn Finance price higher. The 50% Fibonacci retracement, Senkou Span B, and daily Tenkan-Sen reside within the $33,500 to $34,750 value area. Combining those three price levels form considerable resistance to any further movement higher.
The oscillators also hint at continued difficulty moving higher for Yearn Finance price. The Optex Bands have developed a relatively extreme slope, warning of extreme overbought conditions getting hit soon. The Relative Strength Index remains in bear market conditions and oscillates between the two overbought levels in a bear market (65 and 55). The RSI is barely staying above the first overbought level at 55.
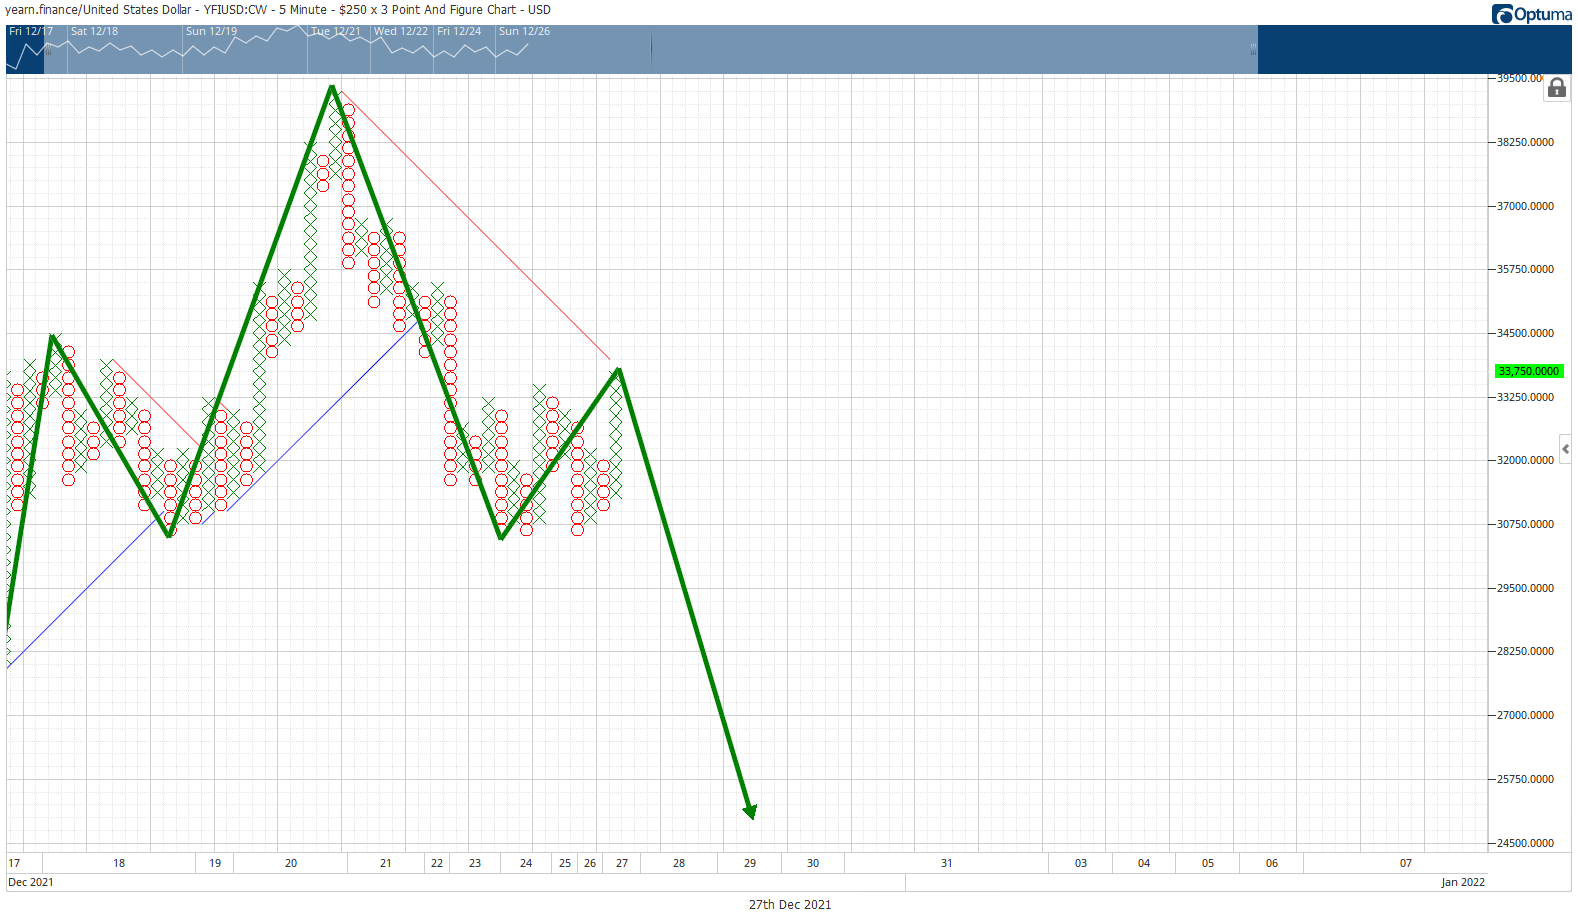
It is expected that Yearn Finance price action will be constrained to the top and bottom of the Cloud. If YFI continues to follow the Cloud, traders should expect a fast drop between December 28 and December 29 below the neckline of the head-and-shoulders pattern on the Point and Figure chart to the bottom of the daily Cloud at the $25,000 value area.
Author

Jonathan Morgan
Independent Analyst
Jonathan has been working as an Independent future, forex, and cryptocurrency trader and analyst for 8 years. He also has been writing for the past 5 years.


