XRP ripple crypto price news today Elliott Wave technical analysis [Video]
![XRP ripple crypto price news today Elliott Wave technical analysis [Video]](https://editorial.fxsstatic.com/images/i/TETHER_XtraLarge.png)
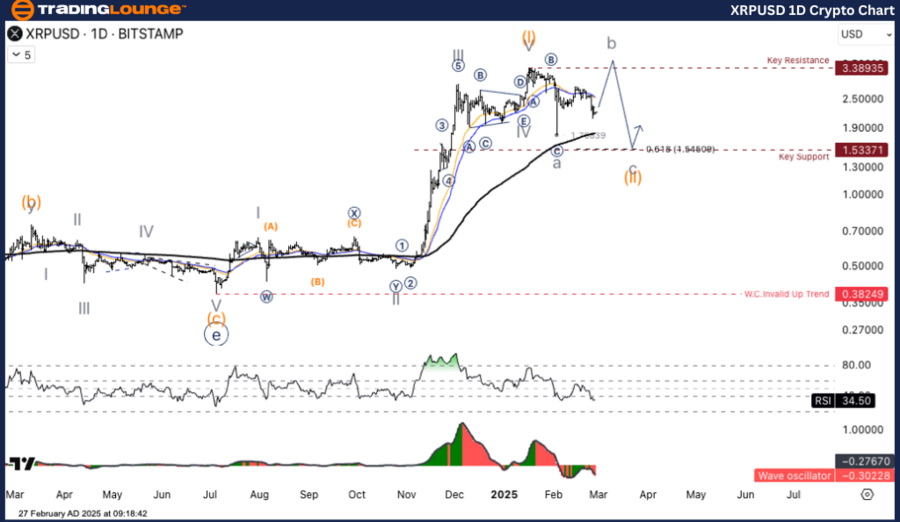
Elliott Wave Analysis TradingLounge Daily Chart.
XRP/ U.S. Dollar (XRPUSD).
XRP/USD Elliott Wave technical analysis
-
Function: Counter Trend.
-
Mode: Corrective.
-
Structure: Flat.
-
Position: Wave ((B)).
-
Next higher degree direction: Wave IV.
-
Wave cancellation level: Not specified.
Details:
The current XRPUSD structure indicates an ongoing downward correction within Corrective Wave (B). There remains potential for further downside movement before stabilization.
XRP/ U.S. Dollar (XRPUSD) Trading Strategy.
XRP has completed Wave (I) and has entered a bearish correction phase (Wave (II)). A short-term recovery (Wave B up) is possible before transitioning into the final corrective phase (Wave C), which is projected to reach the key support level of 1.533 USD.
Trading Strategies.
-
Strategy
-
Long Strategy
Entry: Buy when the price pulls back to a key support level-
If XRP tests the $1.533 support and buying pressure resurfaces
-
Target a profit range between 2.50 - 3.38 USD
-
-
Risk Management:
-
If the price drops below 1.533 USD, reassess the position.
-
-
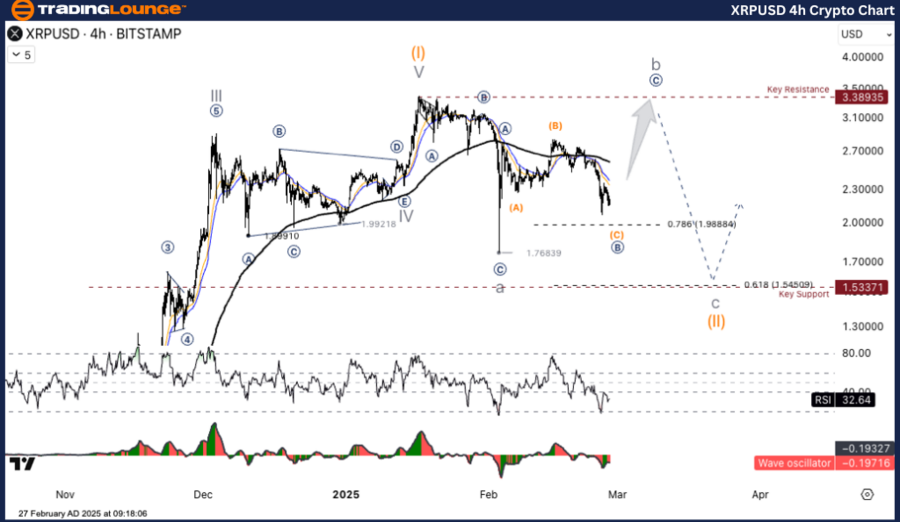
Elliott Wave Analysis TradingLounge H4 Chart.
XRP/ U.S. Dollar (XRPUSD).
XRP/USD Elliott Wave technical analysis
-
Function: Counter Trend.
-
Mode: Corrective.
-
Structure: Flat.
-
Position: Wave ((B)).
-
Next higher degree direction: Wave IV.
-
Wave cancellation level: Not specified.
Details:
The current structure of XRPUSD remains in a corrective phase within Wave (B), suggesting a possible further decline before a reversal occurs.
XRP/ U.S. Dollar (XRPUSD) Trading Strategy.
XRP has completed Wave (I) and is experiencing a corrective downturn in Wave (II). A temporary upward correction (Wave B) may precede the final leg (Wave C), with 1.533 USD acting as the key support zone.
Trading Strategies.
-
Strategy
-
Long Strategy
Entry: Buy when the price pulls back to a key support level-
If XRP reaches $1.533 support and buying pressure re-emerges
-
Aim for a profit target between 2.50 - 3.38 USD
-
-
Risk Management:
-
If the price breaks below 1.533 USD, reconsider the trade
-
-
TradingLounge analyst: Kittiampon Somboonsod, CEWA.
XRP/USD Elliott Wave technical analysis [Video]
Author

Peter Mathers
TradingLounge
Peter Mathers started actively trading in 1982. He began his career at Hoei and Shoin, a Japanese futures trading company.


