- XRP price shows a clear domination of bears after an 18% crash between April 18 and 21.
- The four-hour chart shows key accumulation levels before Ripple bulls kick-start a massive 50% uptrend.
- A failure to hold above the $0.396 level will signal a weakness in buyers’ strength and potentially invalidate the bullish thesis.
XRP price has been hovering inside a larger range, as mentioned in previous publications. The recent bull rally pushed it to retest the range high. However, as momentum exhausted and investors resorted to profit-taking, the gains came undone, and Rippl returned to the mean.
In this article, we will take a look at the short-term and long-term outlook for XRP price and potential accumulation levels for the long run.
Also read: Top 3 Price Prediction Bitcoin, Ethereum, Ripple: Crypto markets await BTC’s cue
XRP price ready to take control
XRP price has bounced nearly 8% after the recent 18% decline between April 18 and 21. This move indicates that the bears are slowly giving away control. A minor pullback is likely to be followed by an extension of this recovery rally to $0.489, which is the midpoint of the 18% descent. In some cases, Ripple bulls could continue their ascent and tag the $0.512 hurdle.
This is the short-term outlook for XRP price and provides scalpers and day traders with some good opportunities.
However, if XRP price manages to flip the $0.537 hurdle, it will signal a breakout from a major high timeframe level. In such a case, investors need to focus on the three-day chart of XRP price.
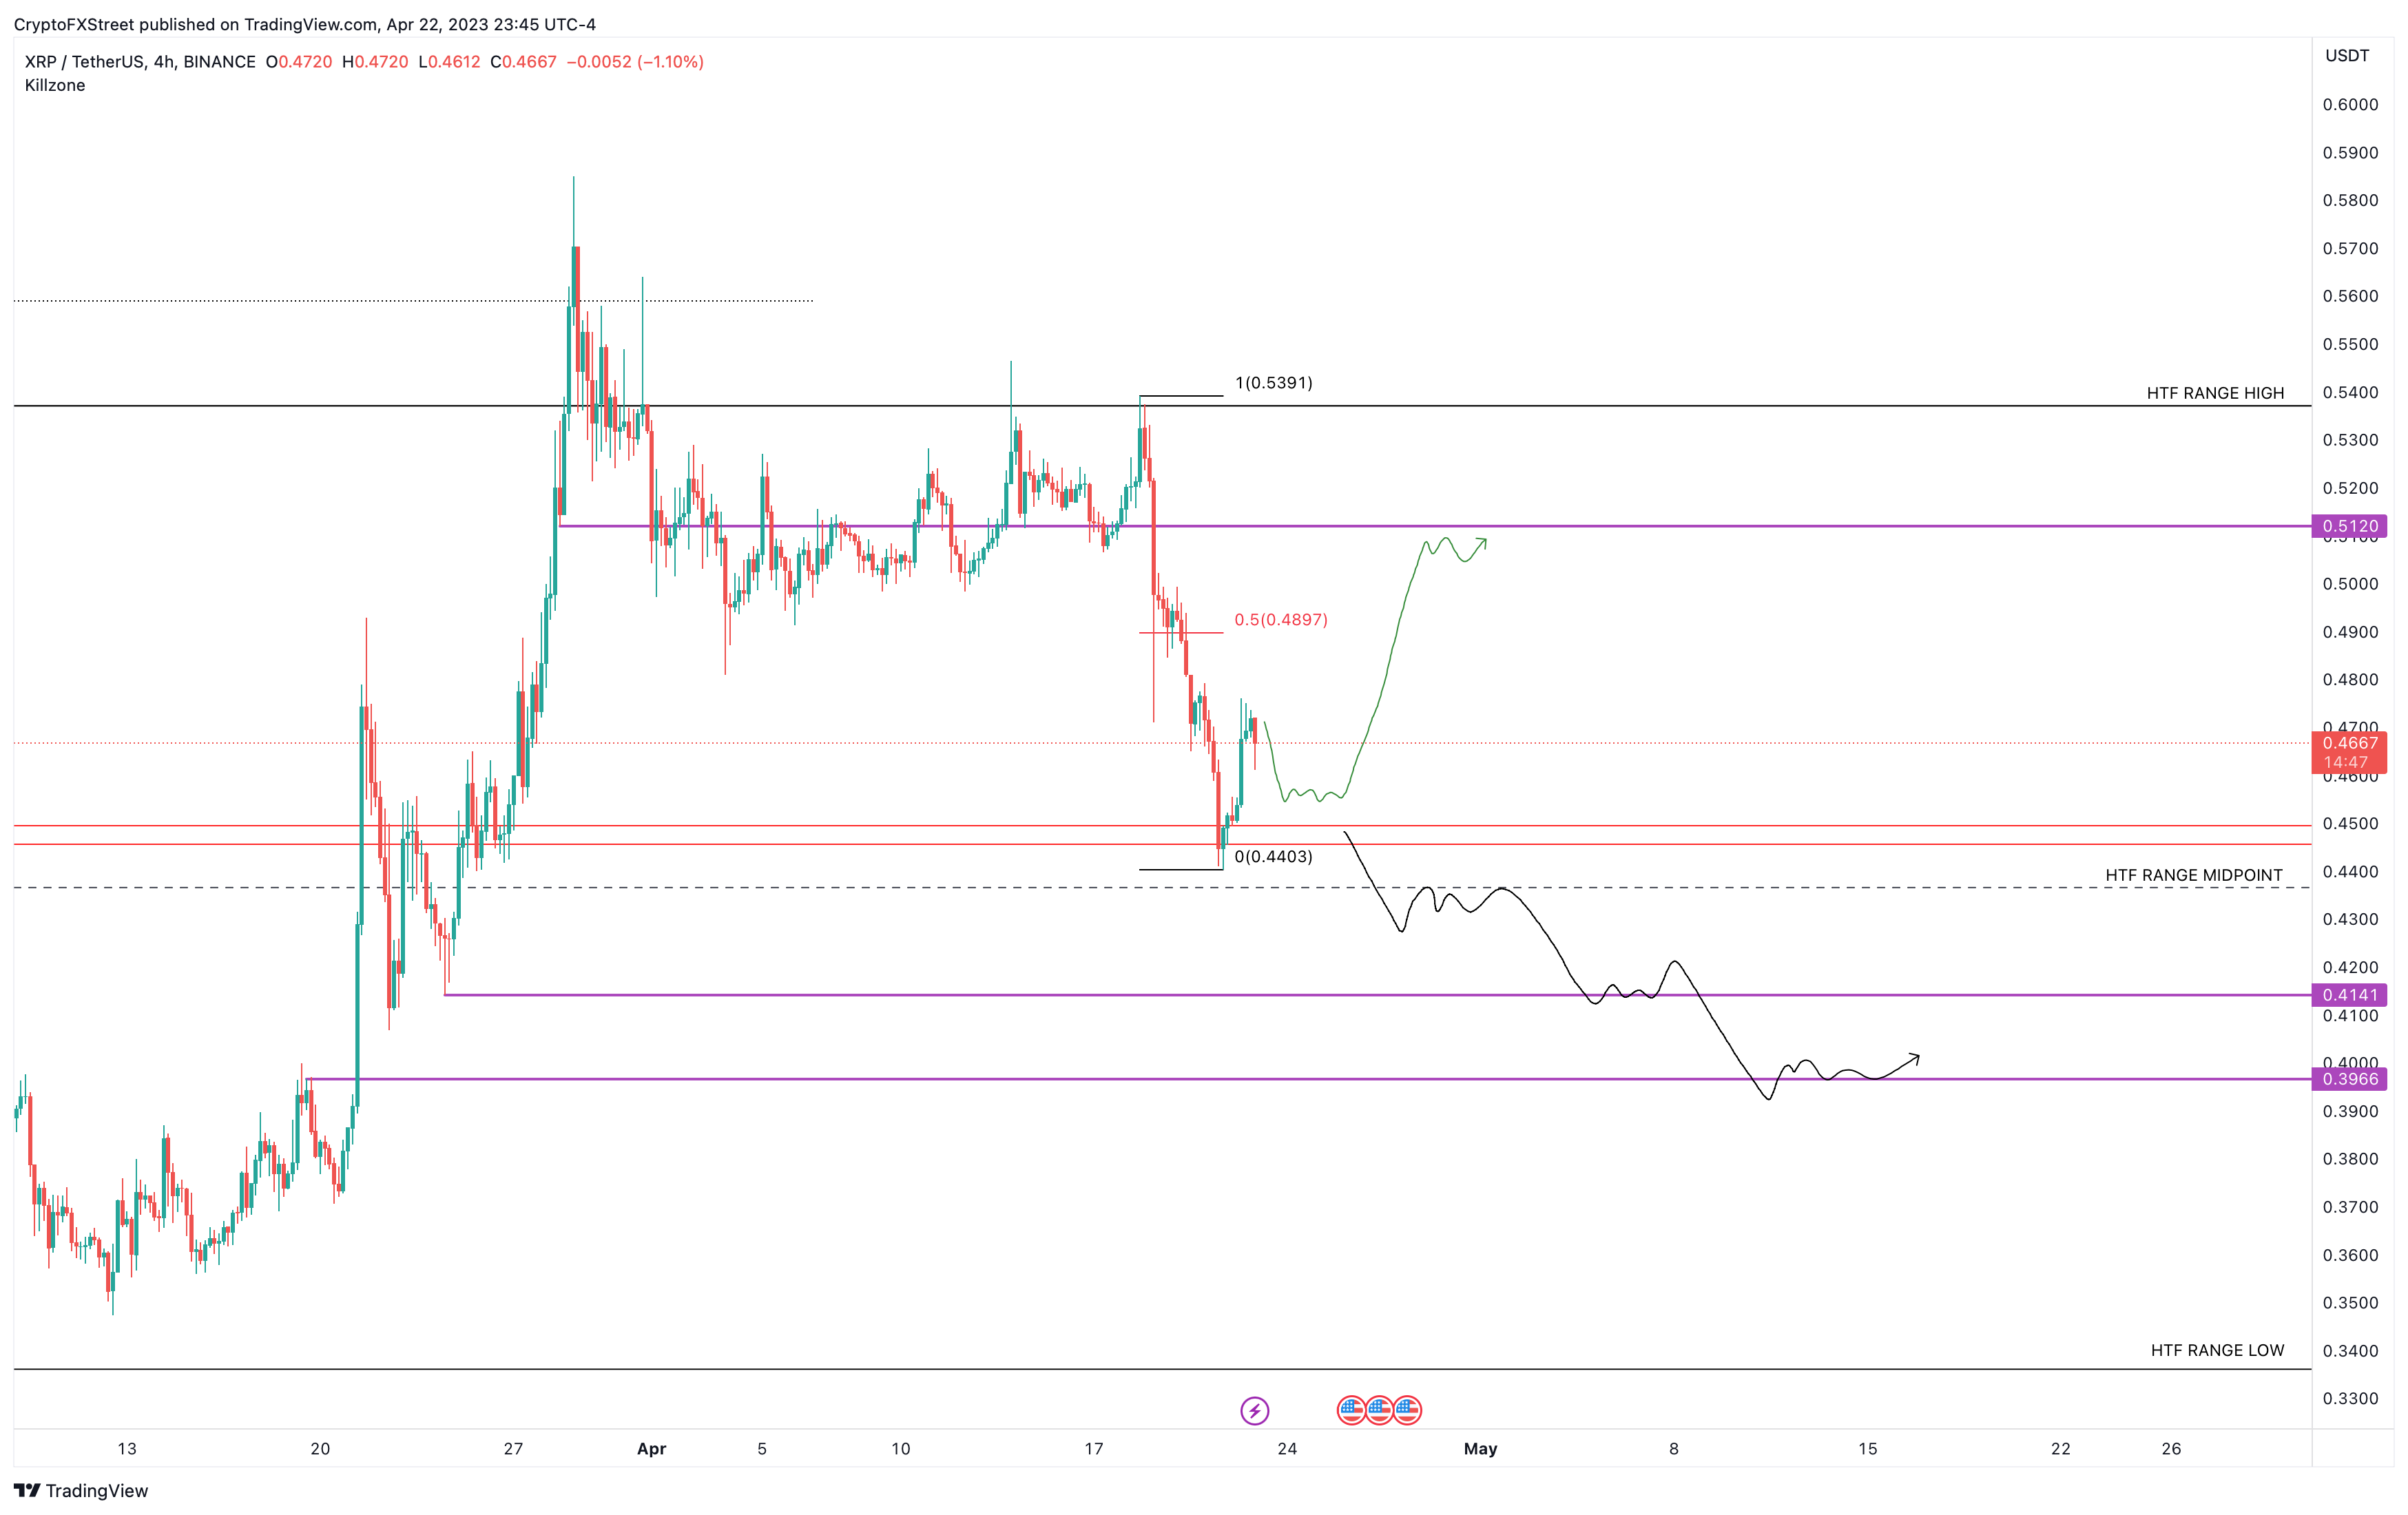
XRP/USDT 4-hour chart
The three-day chart shows that XRP price has been hovering inside the $0.537 to $0.336 range for nearly a year now. If the remittance token does breach this range to the upside, it would trigger a massive bullish response.
In such a case, XRP price could retest the $0.633 level, which is the midpoint of the 69% crash witnessed between March 26, 2022, and June 18, 2022. This move would constitute a 35% gain but an extension to the $0.704 hurdle would bring it to a 50% gain for holders.
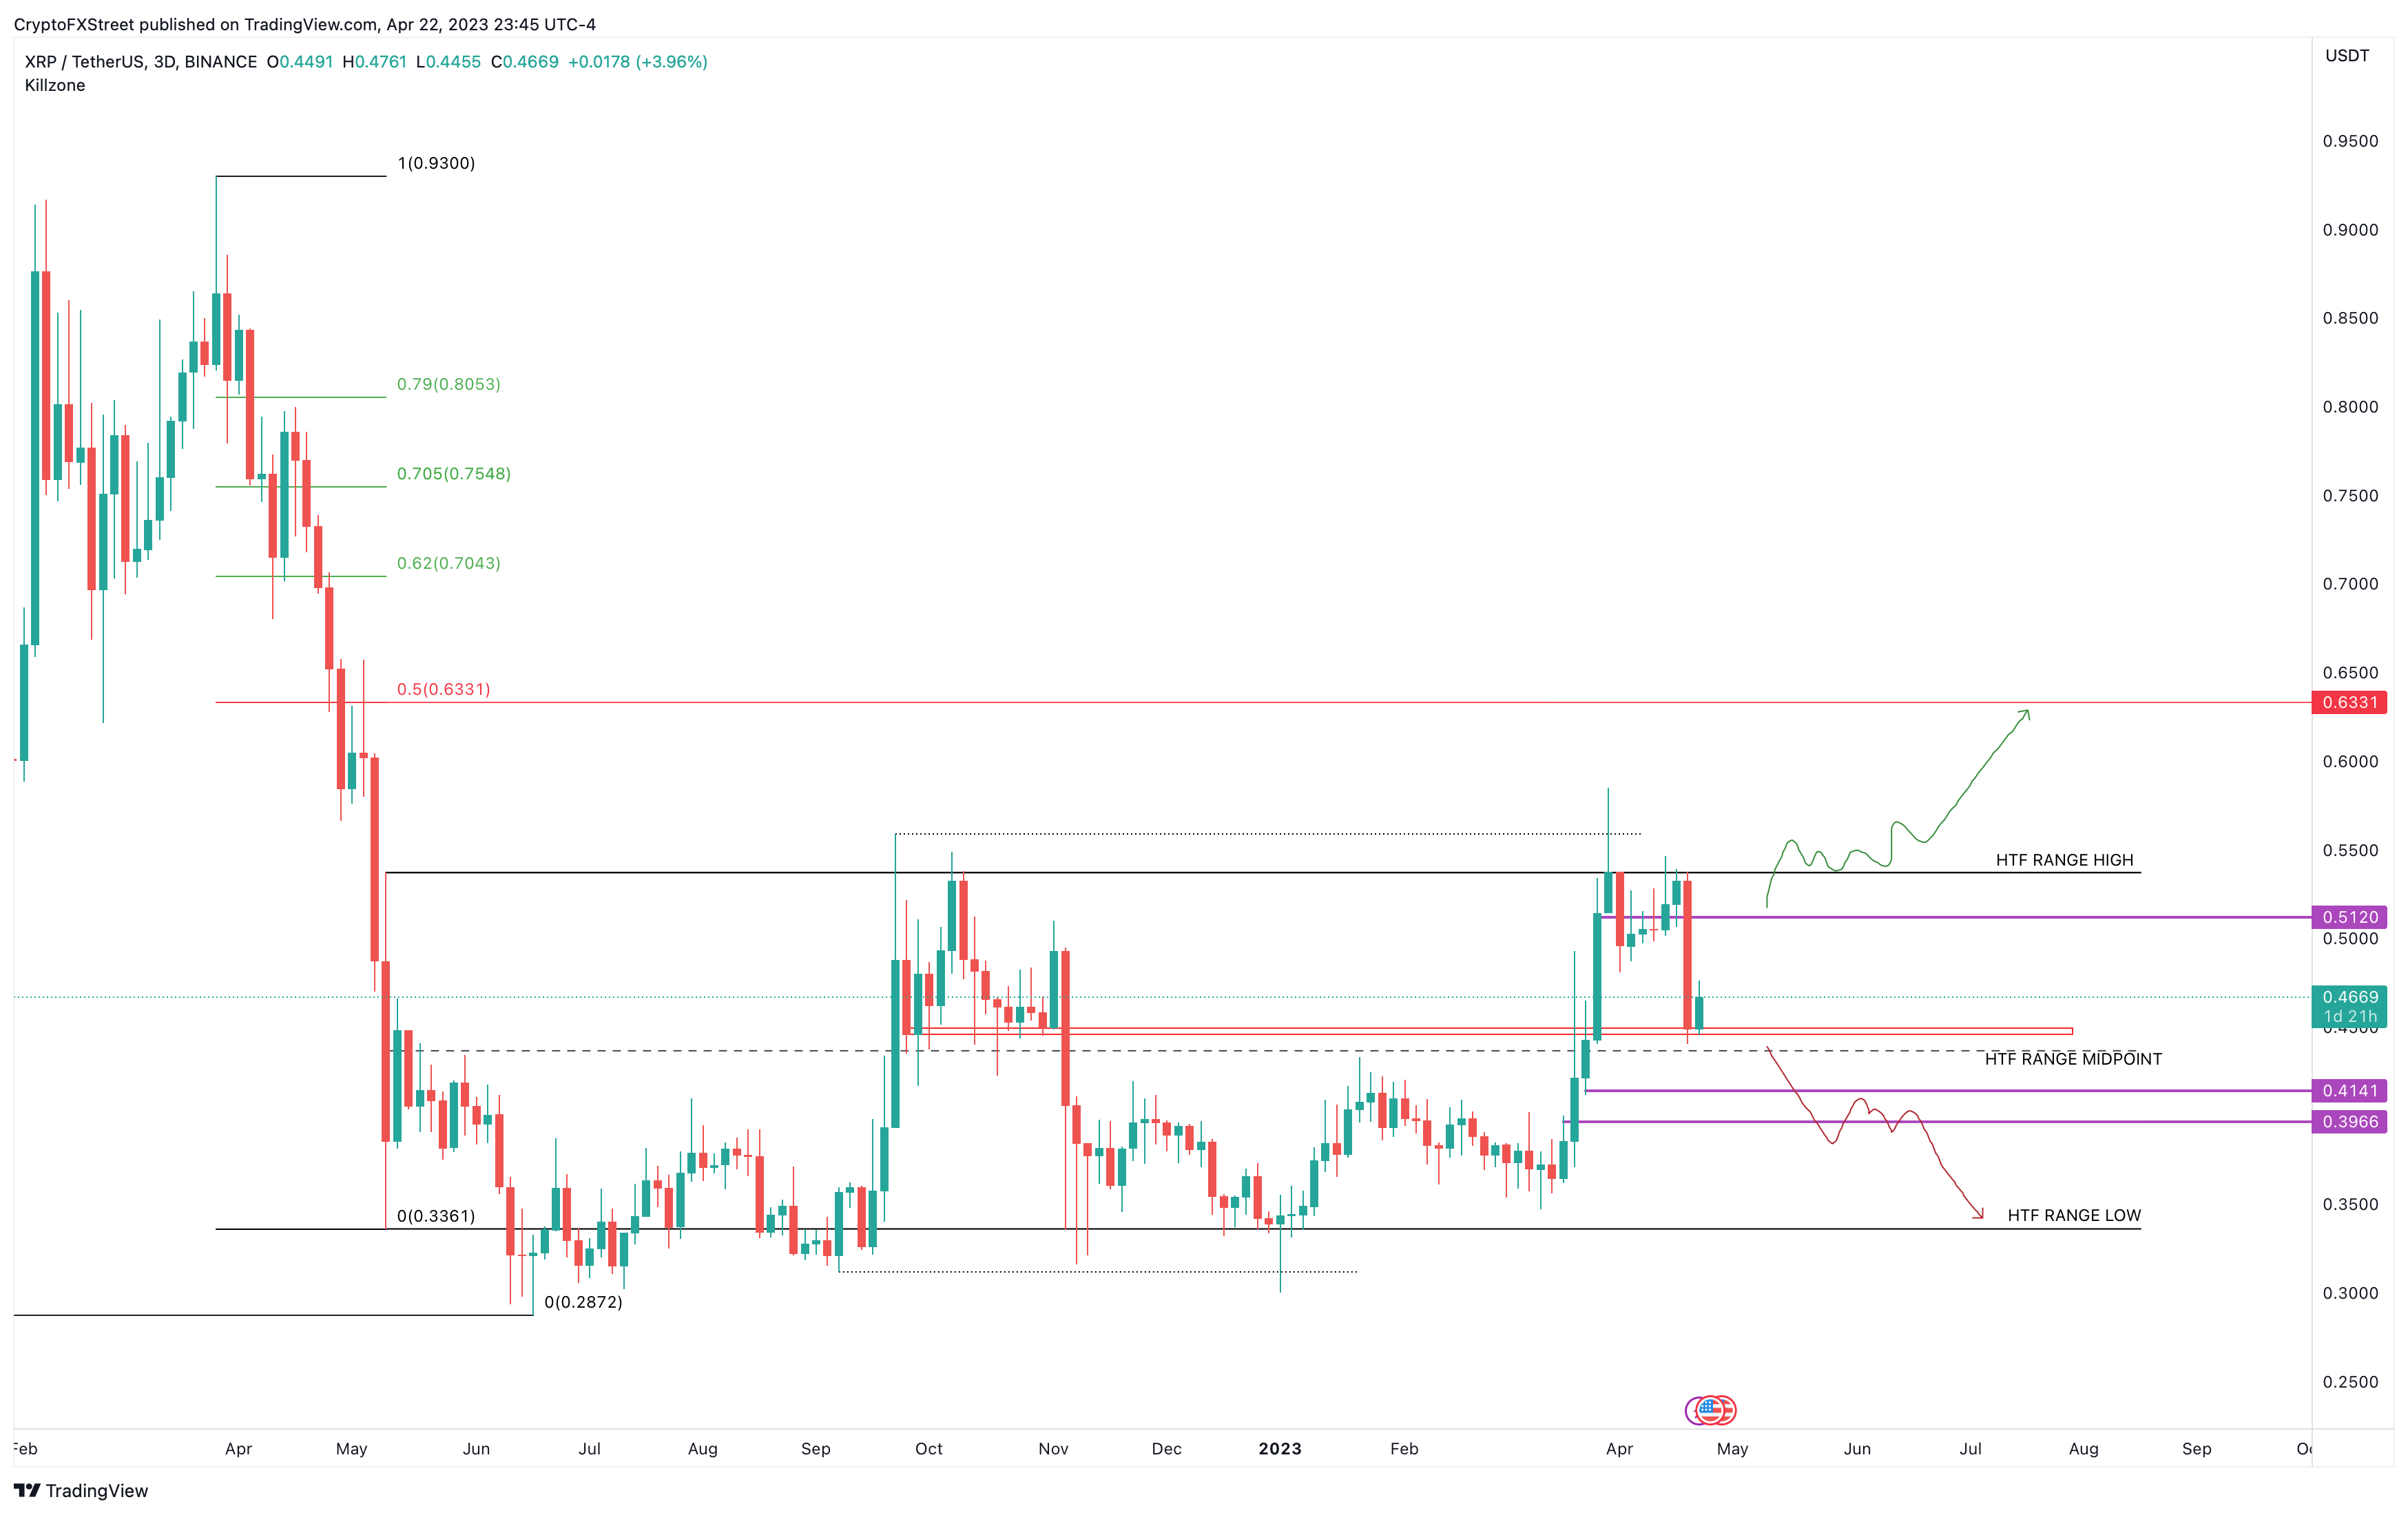
XRP/USDT 3-day chart
A breakdown of the range’s midpoint at $0.436 is the first telltale sign of weakness in buyers’ camp. However, if XRP price slices through the $0.414 and $0.396 levels, it would invalidate the bullish thesis and potentially trigger a crash to the range low at $0.336.
Information on these pages contains forward-looking statements that involve risks and uncertainties. Markets and instruments profiled on this page are for informational purposes only and should not in any way come across as a recommendation to buy or sell in these assets. You should do your own thorough research before making any investment decisions. FXStreet does not in any way guarantee that this information is free from mistakes, errors, or material misstatements. It also does not guarantee that this information is of a timely nature. Investing in Open Markets involves a great deal of risk, including the loss of all or a portion of your investment, as well as emotional distress. All risks, losses and costs associated with investing, including total loss of principal, are your responsibility. The views and opinions expressed in this article are those of the authors and do not necessarily reflect the official policy or position of FXStreet nor its advertisers. The author will not be held responsible for information that is found at the end of links posted on this page.
If not otherwise explicitly mentioned in the body of the article, at the time of writing, the author has no position in any stock mentioned in this article and no business relationship with any company mentioned. The author has not received compensation for writing this article, other than from FXStreet.
FXStreet and the author do not provide personalized recommendations. The author makes no representations as to the accuracy, completeness, or suitability of this information. FXStreet and the author will not be liable for any errors, omissions or any losses, injuries or damages arising from this information and its display or use. Errors and omissions excepted.
The author and FXStreet are not registered investment advisors and nothing in this article is intended to be investment advice.
Recommended Content
Editors’ Picks

Top gainers Virtuals Protocol, Floki, Hyperliquid: Altcoins extend gains alongside Bitcoin
The cryptocurrency market sustains a market-wide bullish outlook at the time of writing on Tuesday, led by Bitcoin (BTC) and select altcoins, including Virtuals Protocol (VIRTUAL), Floki, and Hyperliquid (HYPE).

Token unlocks over $625 million this week across major projects SUI, OP, SOL, AVAX and DOGE
According to Wu Blockchain, 11 altcoins with one-time tokens unlock more than $5 million each in the next seven days. The total value of cliff and linear unlocked tokens exceeds $625 million.

TRUMP meme coin on-chain activity surged following dinner announcement: Kaiko
Kaiko Research published a report on Monday highlighting the significant impact of TRUMP's team dinner announcement on the meme coin sector. The announcement triggered a surge in on-chain activity and trading volumes, with TRUMP accounting for nearly 50% of all meme coin trading volume.

Coinbase launches new Bitcoin Yield Fund, offering investors 4–8% annual returns
Coinbase has launched a Bitcoin Yield Fund, aiming to offer non-U.S. investors sustainable 4–8% returns paid directly in Bitcoin.

Bitcoin Weekly Forecast: BTC consolidates after posting over 10% weekly surge
Bitcoin (BTC) price is consolidating around $94,000 at the time of writing on Friday, holding onto the recent 10% increase seen earlier this week.

The Best brokers to trade EUR/USD
SPONSORED Discover the top brokers for trading EUR/USD in 2025. Our list features brokers with competitive spreads, fast execution, and powerful platforms. Whether you're a beginner or an expert, find the right partner to navigate the dynamic Forex market.