- XRP price witnessed a dip below $0.600 during intra-day trading hours on Monday.
- The decline in price was unexpected, given Bitcoin price crossed $42,000, and Ripple shares a rather positive correlation with the crypto.
- One likely reason is the lack of interest displayed by institutions that continue to pick Solana over XRP.
XRP price is showing signs of a recovery with the potential to breach its next major resistance level. However, to the market’s surprise, the Ripple native token took a different direction than the rest of the altcoins despite Bitcoin price marking a major milestone on Monday. While a specific reason cannot be named, one of the biggest factors likely is the lack of institutional interest.
Ripple needs more from institutions
Ripple has been a community favorite token for years now, but its target, more importantly, is the institutions since they are considered to be the drivers of the next bull run. At the moment, XRP seems to be lacking on that front and is being surpassed by Solana by a significant mile.
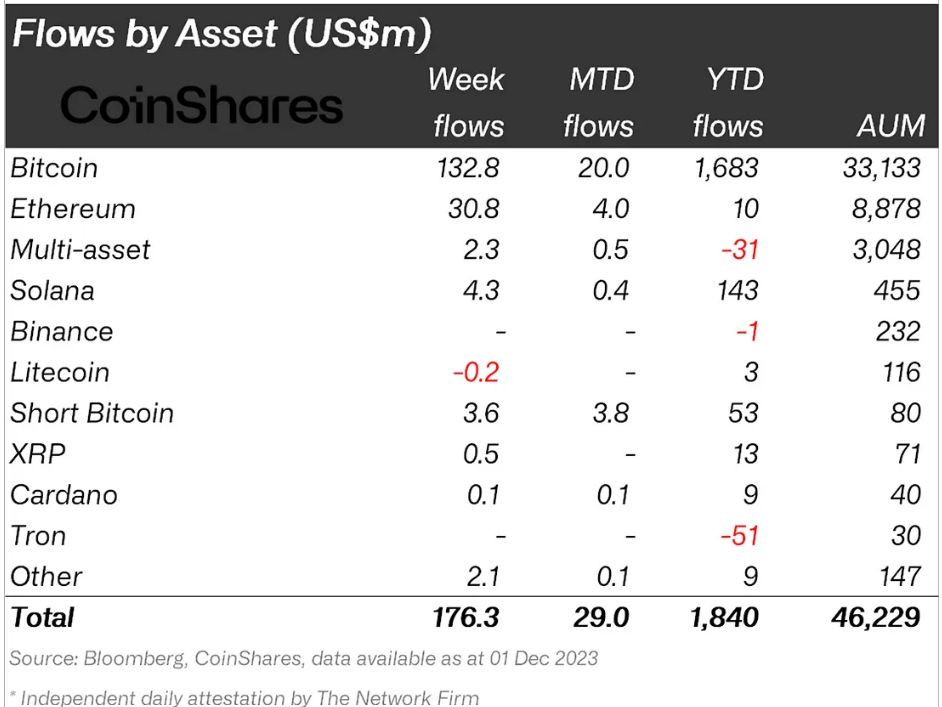
According to the weekly inflows registered when it comes to exchange-traded investment products, XRP has noted inflows worth $0.5 million for the week ending December 1. Solana, on the other hand, marked $4.3 million worth of institutional money flowing into the ETP. The difference is not as significant, but when the yearly flows are compared, the gap becomes evident.
Institutional inflows
Ripple over the past 11 months marked $13 million worth of inflows, which is less than 10% of SOL’s total inflows since the beginning of 2023, standing tall at $143 million. While this has not made a direct impact on the token in the past, some influence of the same can be seen at the moment.
XRP price and investors’ hearts drop
XRP price made its investors witness a rather surprising turn of events on Monday as the altcoin fell by almost 6% during the intra-day trading hours. This resulted in the Ripple token losing the support of $0.600. The dip, however, did not result in major losses except for $4 million worth of long liquidations as the price recovered in the next half hour.
If such instances are repeated where Ripple fails to see institutional interest, XRP price will likely decline. However, in the short term, the altcoin is far from a fall. Instead, it is showing stronger signs of recovery. Trading at $0.622, the cryptocurrency is close to breaching the $0.644 resistance.
The Relative Strength Index (RSI) and the Moving Average Convergence Divergence (MACD) are both exhibiting positive signals at the moment, which would support a rally towards $0.644 and beyond.
XRP/USD 1-day chart
But if a breach fails, XRP price is also vulnerable to a fall to $0.600. In the short term, if this support line is lost, the bullish thesis would be invalidated, and the Ripple token will likely hit $0.551.
Cryptocurrency metrics FAQs
What is circulating supply?
The developer or creator of each cryptocurrency decides on the total number of tokens that can be minted or issued. Only a certain number of these assets can be minted by mining, staking or other mechanisms. This is defined by the algorithm of the underlying blockchain technology. Since its inception, a total of 19,445,656 BTCs have been mined, which is the circulating supply of Bitcoin. On the other hand, circulating supply can also be decreased via actions such as burning tokens, or mistakenly sending assets to addresses of other incompatible blockchains.
What is market capitalization?
Market capitalization is the result of multiplying the circulating supply of a certain asset by the asset’s current market value. For Bitcoin, the market capitalization at the beginning of August 2023 is above $570 billion, which is the result of the more than 19 million BTC in circulation multiplied by the Bitcoin price around $29,600.
What is trading volume?
Trading volume refers to the total number of tokens for a specific asset that has been transacted or exchanged between buyers and sellers within set trading hours, for example, 24 hours. It is used to gauge market sentiment, this metric combines all volumes on centralized exchanges and decentralized exchanges. Increasing trading volume often denotes the demand for a certain asset as more people are buying and selling the cryptocurrency.
What is funding rate?
Funding rates are a concept designed to encourage traders to take positions and ensure perpetual contract prices match spot markets. It defines a mechanism by exchanges to ensure that future prices and index prices periodic payments regularly converge. When the funding rate is positive, the price of the perpetual contract is higher than the mark price. This means traders who are bullish and have opened long positions pay traders who are in short positions. On the other hand, a negative funding rate means perpetual prices are below the mark price, and hence traders with short positions pay traders who have opened long positions.
Information on these pages contains forward-looking statements that involve risks and uncertainties. Markets and instruments profiled on this page are for informational purposes only and should not in any way come across as a recommendation to buy or sell in these assets. You should do your own thorough research before making any investment decisions. FXStreet does not in any way guarantee that this information is free from mistakes, errors, or material misstatements. It also does not guarantee that this information is of a timely nature. Investing in Open Markets involves a great deal of risk, including the loss of all or a portion of your investment, as well as emotional distress. All risks, losses and costs associated with investing, including total loss of principal, are your responsibility. The views and opinions expressed in this article are those of the authors and do not necessarily reflect the official policy or position of FXStreet nor its advertisers. The author will not be held responsible for information that is found at the end of links posted on this page.
If not otherwise explicitly mentioned in the body of the article, at the time of writing, the author has no position in any stock mentioned in this article and no business relationship with any company mentioned. The author has not received compensation for writing this article, other than from FXStreet.
FXStreet and the author do not provide personalized recommendations. The author makes no representations as to the accuracy, completeness, or suitability of this information. FXStreet and the author will not be liable for any errors, omissions or any losses, injuries or damages arising from this information and its display or use. Errors and omissions excepted.
The author and FXStreet are not registered investment advisors and nothing in this article is intended to be investment advice.
Recommended Content
Editors’ Picks

Michael Saylor predicts Bitcoin to surge to $100K by year-end
MicroStrategy's executive chairman, Michael Saylor, predicts Bitcoin will hit $100,000 by the end of 2024, calling the United States (US) election outcome the most significant event for Bitcoin in the last four years.

Ripple surges to new 2024 high on XRP Robinhood listing, Gensler departure talk
Ripple price rallies almost 6% on Friday, extending the 12% increase seen on Thursday, following Robinhood’s listing of XRP on its exchange. XRP reacts positively to recent speculation about Chair Gary Gensler leaving the US Securities and Exchange Commission.

Bitcoin Weekly Forecast: New high of $100K or correction to $78K?
Bitcoin surged to a new all-time high of $93,265 in the first half of the week, followed by a slight decline in the latter half. Reports highlight that Bitcoin’s current level is still not overvalued and could target levels above $100,000 in the coming weeks.

Top 3 Price Prediction Bitcoin, Ethereum, Ripple: BTC to 100k or pullback to 78k?
Bitcoin and Ethereum showed a modest recovery on Friday following Thursday's downturn, yet momentum indicators suggest continuing the decline as signs of bull exhaustion emerge. Ripple is approaching a key resistance level, with a potential rejection likely leading to a decline ahead.

Bitcoin: New high of $100K or correction to $78K?
Bitcoin (BTC) surged up to 16% in the first half of the week, reaching a new all-time high of $93,265, followed by a slight decline in the latter half. Reports suggest the continuation of the ongoing rally as they highlight that the current trading level is still not overvalued and that project targets are above $100K in the coming weeks.

Best Forex Brokers with Low Spreads
VERIFIED Low spreads are crucial for reducing trading costs. Explore top Forex brokers offering competitive spreads and high leverage. Compare options for EUR/USD, GBP/USD, USD/JPY, and Gold.

