XRP Price Prediction: This bearish continuation pattern could trigger a 70% crash
- XRP price shows the formation of a bear flag setup that forecasts a 70% crash to $0.098.
- A breakdown of the $0.324 support floor will trigger this pessimistic move.
- A daily candlestick close above $0.404 will invalidate the bearish outlook.

XRP price reveals a massive bearish setup that could ruin its recovery rally, especially if bulls fail to invalidate it. Therefore, investors need to exercise caution as this outlook is in line with the macro bearish structure of the crypto market.
XRP price and the bearish revelation
XRP price crashed roughly 69% between March 28 and June 18 without showing a bullish interruption. After this massive nosedive was done, Ripple started its consolidation in the form of higher highs and higher lows, resulting in the formation of an ascending parallel channel.
From a big-picture perspective, viewing the XRP price action from March 28 to August 31 looks like a bear flag continuation pattern in play. Bitcoin has been sporting a similar structure since the start of 2022.
This technical formation forecasts a 69% crash, obtained by measuring the flagpole’s height and adding it to the breakout point at $0.323. Therefore, investors should look for a daily candlestick close below the aforementioned level.
Doing this will firmly trigger the bearish outlook of the continuation pattern that forecasts a 69% crash to $0.098.
However, the remittance token will find stable support between $0.211 and $0.235, where buyers can step in and prematurely reverse the downtrend. However, a breakdown of this area could result in a steep nosedive in XRP price to $0.098.
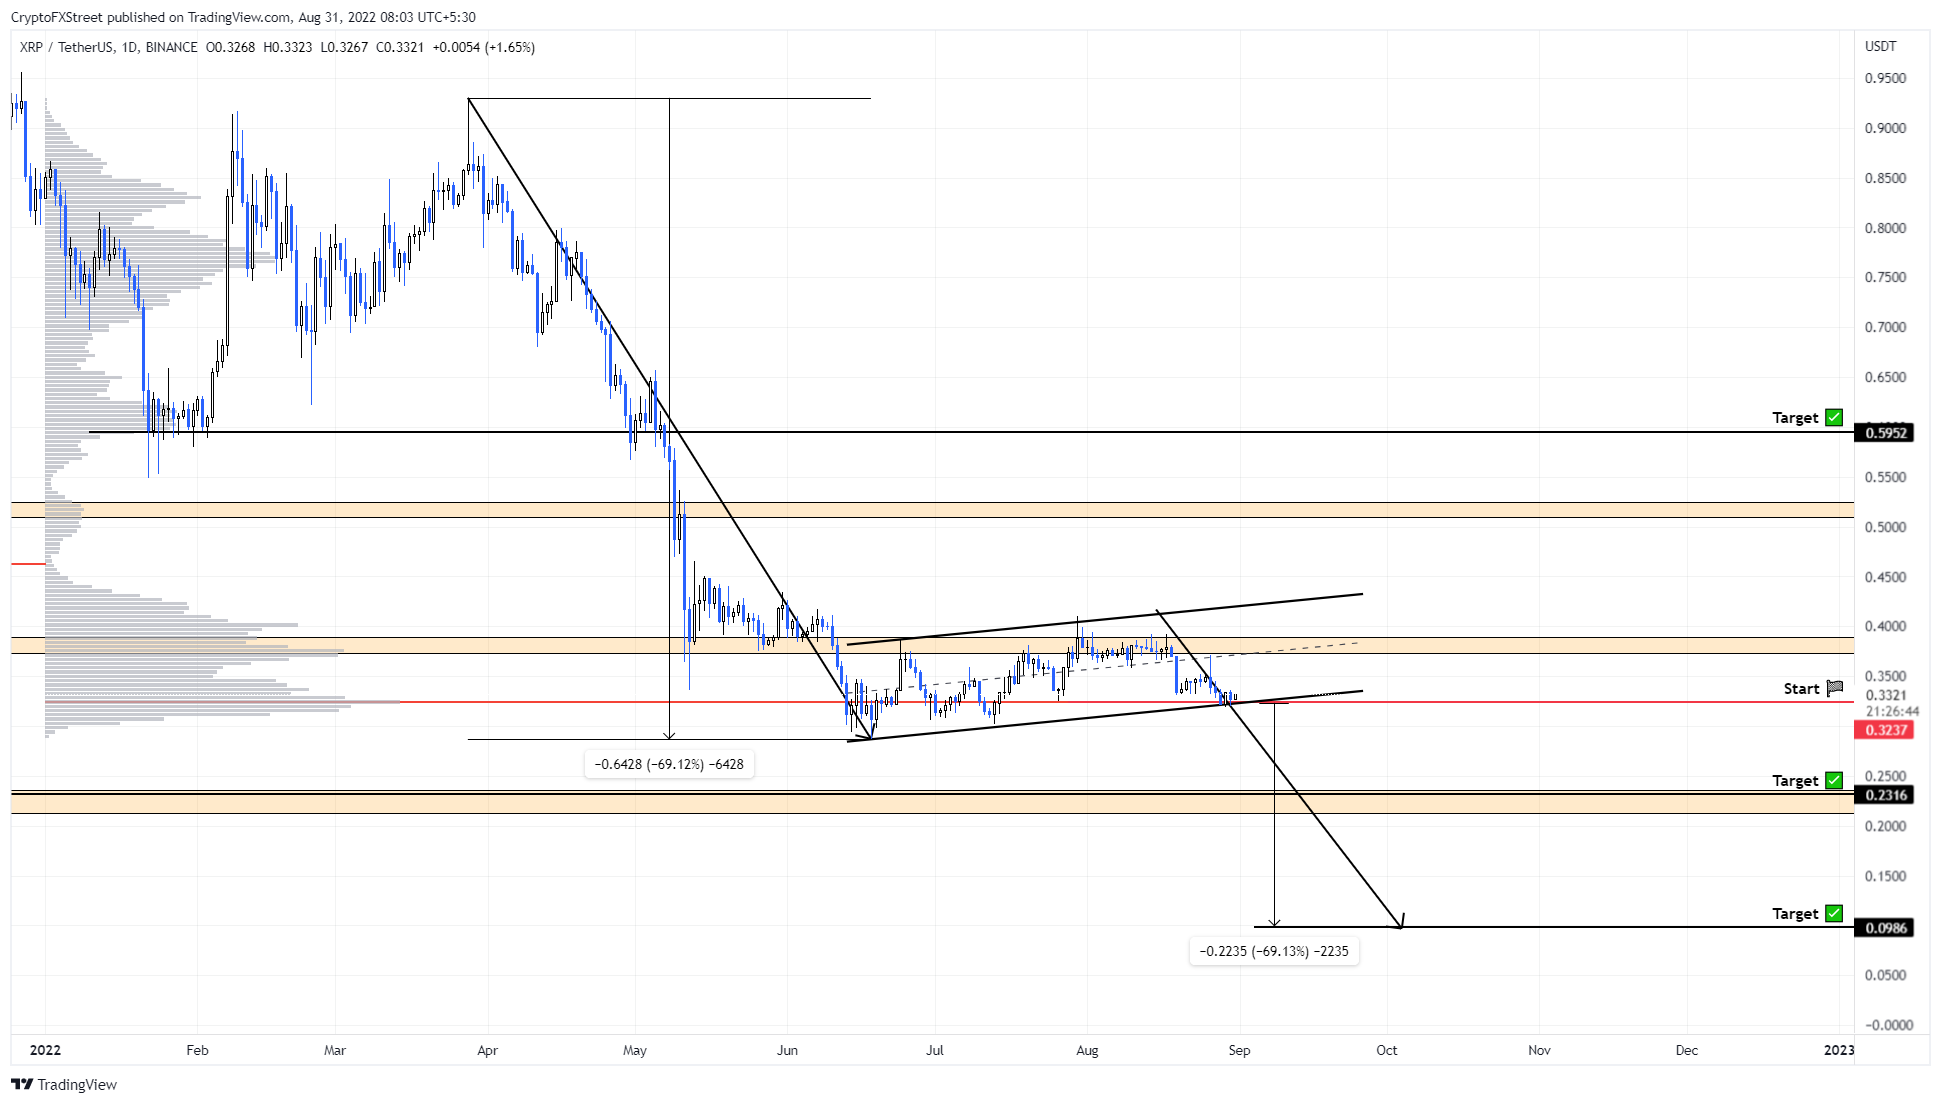
XRP/USDT 1-day chart
Reasons supporting this uber bearish scenario
While this XRP price outlook seems massively bearish, investors should note that many countries' geopolitical and economic conditions are on the brink of a recession. Central banks around the world are tightening interest rates in hopes of controlling the inflation rate. If the US economy does slip into a recession, it could cause a catastrophic effect on all risk-on assets, including cryptocurrencies.
Moreover, from a purely technical perspective, Bitcoin price shows that the macro bottom is not in yet and could occur anywhere between $13,500 to $12,000. Hence, a slip in BTC or another sell-off is enough to trigger a correction in altcoins due to the inherent correlation.
Rising tensions between the Russia vs. Ukraine and China v. Taiwan could be another trigger from a macro perspective that could trigger unprecedented moves in the stock market and ripple out into the crypto ecosystems.
Therefore, investors should keep an open mind about the things that could occur and trigger another bearish outlook for XRP price.
However, a daily candlestick close above the immediate high volume node at $0.404 will flip the resistance box into a support floor and invalidate the bearish outlook. Moreover, the volume profile considerably thins out above this level, indicating that XRP price could teleport to $0.600, where the next high volume node resides.
Note:
While the above outlook is a long-term play, the video attached below takes a look at XRP price from a much lower time frame outlook.
Author

Akash Girimath
FXStreet
Akash Girimath is a Mechanical Engineer interested in the chaos of the financial markets. Trying to make sense of this convoluted yet fascinating space, he switched his engineering job to become a crypto reporter and analyst.


