- Ripple price fell by 35% in November and recovered half of the losses within 24 hours during the initial US CPI-induced relief rally.
- XRP shows RSI divergence between lows since June 13, hinting that price may be confined to trading within a wide range.
- Invalidation of the bullish scenario is a breach below $0.2936.
XRP price has produced higher lows after every liquidation since June 13. This subtle evidence suggests XRP could be confined to a wide range for weeks. Key levels have been identified to help traders identify profitable scenarios.
XRP will be a challenge
XRP's recent rejection from the $0.50 barrier went far lower than expected. As a sideways triangle formed near $0.50, the technicals showed promising breakout potential. Unfortunately, the optimism was swept away during the second trading week of November as the digital remittance token fell by 35% and invalidated the bullish symmetrical triangle that investors were hoping for.
XRP price currently auctions at $0.38. On November 10, the bulls pulled off an 18% recovery rally, establishing a large bullish engulfing up-bar a few integers short of the $0.40 price level. The Relative Strength Index (RSI) shows the November 9 low at $0.3160 as more oversold than the June 13 bottom at $0.3012. This subtle piece of information suggests XRP has underlying strength and could be the catalyst to challenge recently established shorts in the market.
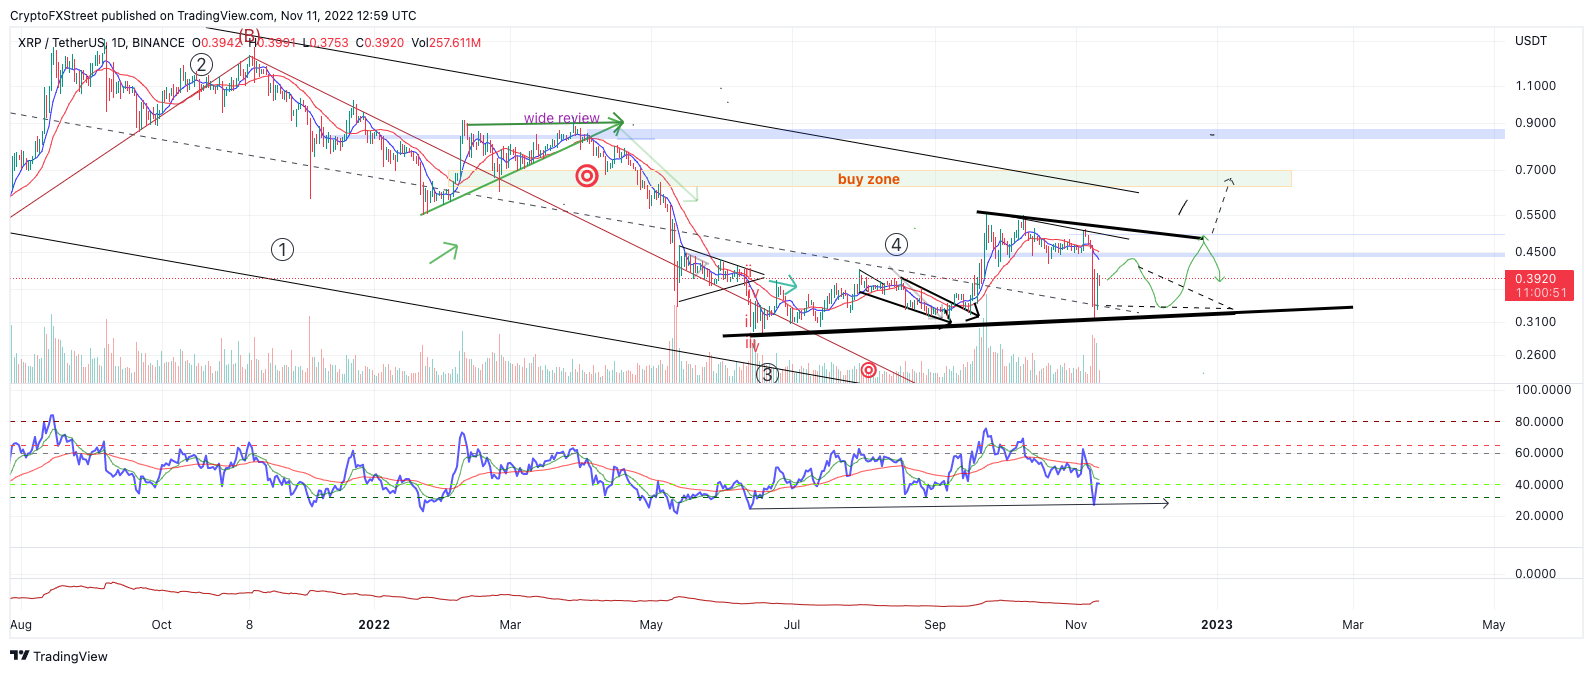
XRPUSDT 1-day chart
XRP price could trade between $0.32 and $0.56 in the coming weeks. Now that the triangle thesis, which projected a rally to the $0.60 zone, is invalid, expecting the unexpected could lead to rewarding gains for patient, healthy risk-taking investors. Liquidity levels as high as $0.66 could face a challenge if the bulls can reconquer the $0.50 zone, but traders should take things one step at a time.
If the market has bullish potential, the June 13 low at $0.30 will need to remain intact. A further decline toward 2020 liquidity levels near $0.26 could occur if the lows are breached. Such a move would result in a 35% decline from the current XRP price.
In the following video, our analysts deep dive into the price action of Ripple, analyzing key levels of interest in the market. -FXStreet Team
Information on these pages contains forward-looking statements that involve risks and uncertainties. Markets and instruments profiled on this page are for informational purposes only and should not in any way come across as a recommendation to buy or sell in these assets. You should do your own thorough research before making any investment decisions. FXStreet does not in any way guarantee that this information is free from mistakes, errors, or material misstatements. It also does not guarantee that this information is of a timely nature. Investing in Open Markets involves a great deal of risk, including the loss of all or a portion of your investment, as well as emotional distress. All risks, losses and costs associated with investing, including total loss of principal, are your responsibility. The views and opinions expressed in this article are those of the authors and do not necessarily reflect the official policy or position of FXStreet nor its advertisers. The author will not be held responsible for information that is found at the end of links posted on this page.
If not otherwise explicitly mentioned in the body of the article, at the time of writing, the author has no position in any stock mentioned in this article and no business relationship with any company mentioned. The author has not received compensation for writing this article, other than from FXStreet.
FXStreet and the author do not provide personalized recommendations. The author makes no representations as to the accuracy, completeness, or suitability of this information. FXStreet and the author will not be liable for any errors, omissions or any losses, injuries or damages arising from this information and its display or use. Errors and omissions excepted.
The author and FXStreet are not registered investment advisors and nothing in this article is intended to be investment advice.
Recommended Content
Editors’ Picks

Bitcoin Weekly Forecast: BTC nosedives below $95,000 as spot ETFs record highest daily outflow since launch
Bitcoin price continues to edge down, trading below $95,000 on Friday after declining more than 9% this week. Bitcoin US spot ETFs recorded the highest single-day outflow on Thursday since their launch in January.

Bitcoin crashes to $96,000, altcoins bleed: Top trades for sidelined buyers
Bitcoin (BTC) slipped under the $100,000 milestone and touched the $96,000 level briefly on Friday, a sharp decline that has also hit hard prices of other altcoins and particularly meme coins.

Solana Price Forecast: SOL’s technical outlook and on-chain metrics hint at a double-digit correction
Solana (SOL) price trades in red below $194 on Friday after declining more than 13% this week. The recent downturn has led to $38 million in total liquidations, with over $33 million coming from long positions.

SEC approves Hashdex and Franklin Templeton's combined Bitcoin and Ethereum crypto index ETFs
The SEC approved Hashdex's proposal for a crypto index ETF. The ETF currently features Bitcoin and Ethereum, with possible additions in the future. The agency also approved Franklin Templeton's amendment to its Cboe BZX for a crypto index ETF.

Bitcoin: 2025 outlook brightens on expectations of US pro-crypto policy
Bitcoin (BTC) price has surged more than 140% in 2024, reaching the $100K milestone in early December. The rally was driven by the launch of Bitcoin Spot Exchange Traded Funds (ETFs) in January and the reduced supply following the fourth halving event in April.

Best Forex Brokers with Low Spreads
VERIFIED Low spreads are crucial for reducing trading costs. Explore top Forex brokers offering competitive spreads and high leverage. Compare options for EUR/USD, GBP/USD, USD/JPY, and Gold.