- XRP price could surge 30% after a bounce from an ascending parallel channel’s lower trend line.
- Resetting social sentiment and funding rates provide a tailwind to the bullish thesis.
- A bearish scenario could come into play if sellers slice through the channel’s lower boundary at $1.70.
XRP price could restart its parabolic upswing as technicals and on-chain metrics point to a massive bullish breakout.
XRP price eyes higher high
On the 4-hour chart, XRP price reveals that its hyperbolic upswing was contained within an ascending parallel channel. This technical formation is a result of higher highs and higher lows connected using trend lines.
The recent surge to $1.96 has seen a 10% retracement toward the channel’s lower trend line. Now, a bounce from this level seems likely. Therefore, a potential spike in buying pressure could push XRP price up by 20%, the immediate supply barrier at $2.09.
A swift yet decisive close above this level could set the stage for another 8.2% surge to the 127.2% Fibonacci extension level.
Interestingly, the 1-hour chart shows that the 42% upswing from $1.35 to $1.92 followed by a consolidation has formed a bull flag pattern. This setup contains an initial burst in XRP price, known as the flagpole, followed by a downward sloping channel, referred to as the flag.
Ripple recently broke out of the flag’s upper trend line, triggering a 30% upswing to $2.27. This target is obtained by adding the flagpole’s height to the breakout point at $1.75.
Interestingly, the setup’s target forecasted on the 1-hour time frame coincides with the projection on the 4-hour chart to the 127.2% Fibonacci extension level.
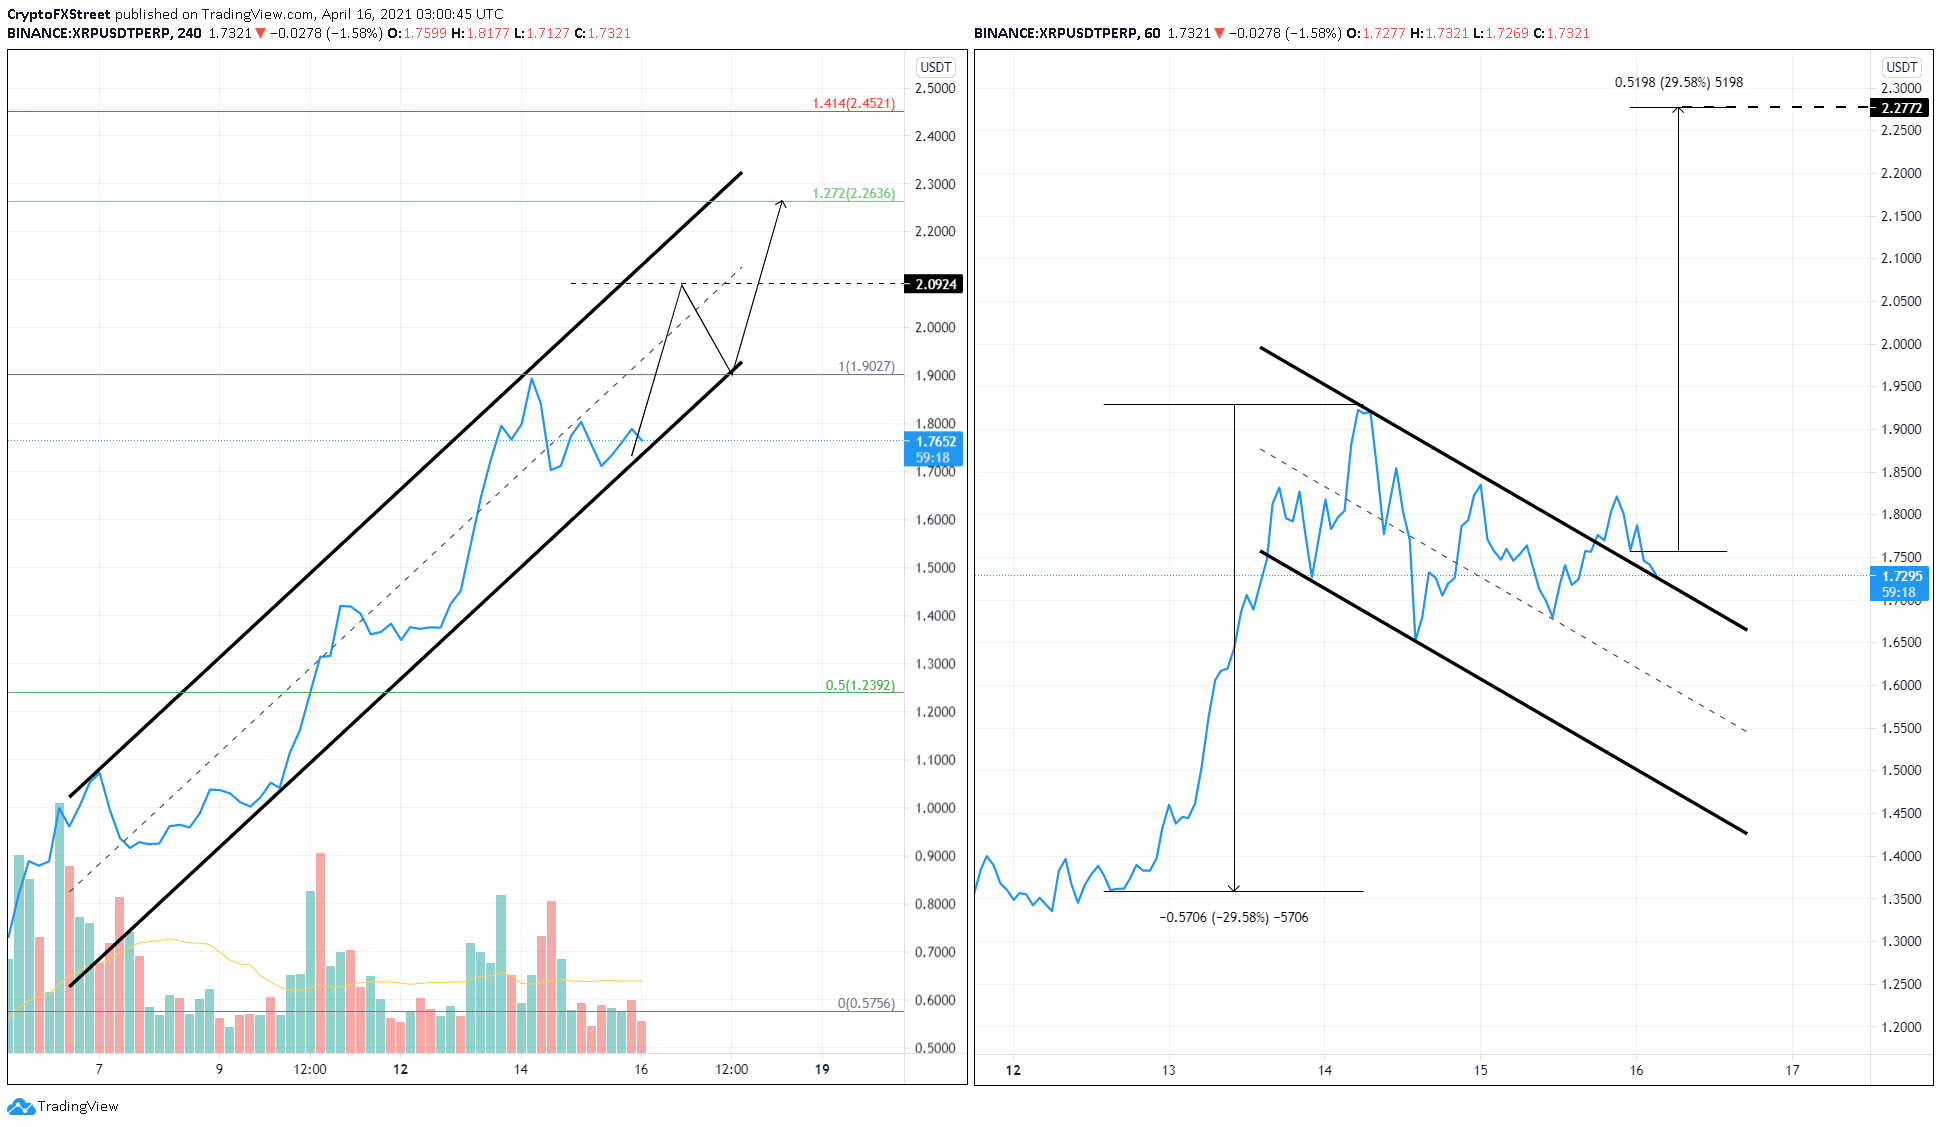
XRP/USDT 4-hour, 1-hour charts
Adding credence to the bullish thesis is the 71% drop in Ripple’s funding rate, as seen in the chart below. This reduction from 0.38% to 0.11% indicates a fall in long positions compared to the rally's start on April 10.
Often, such a reset in funding rate provides traders an opportunity to reopen their longs.
Moreover, Twitter's weighted sentiment on Ripple has seen a collapse from 5.04 to 1.92, suggesting that the remittance token’s hype has subsided. Therefore, this slump sets up the stage for a spike in XRP price from a counter-sentiment perspective.
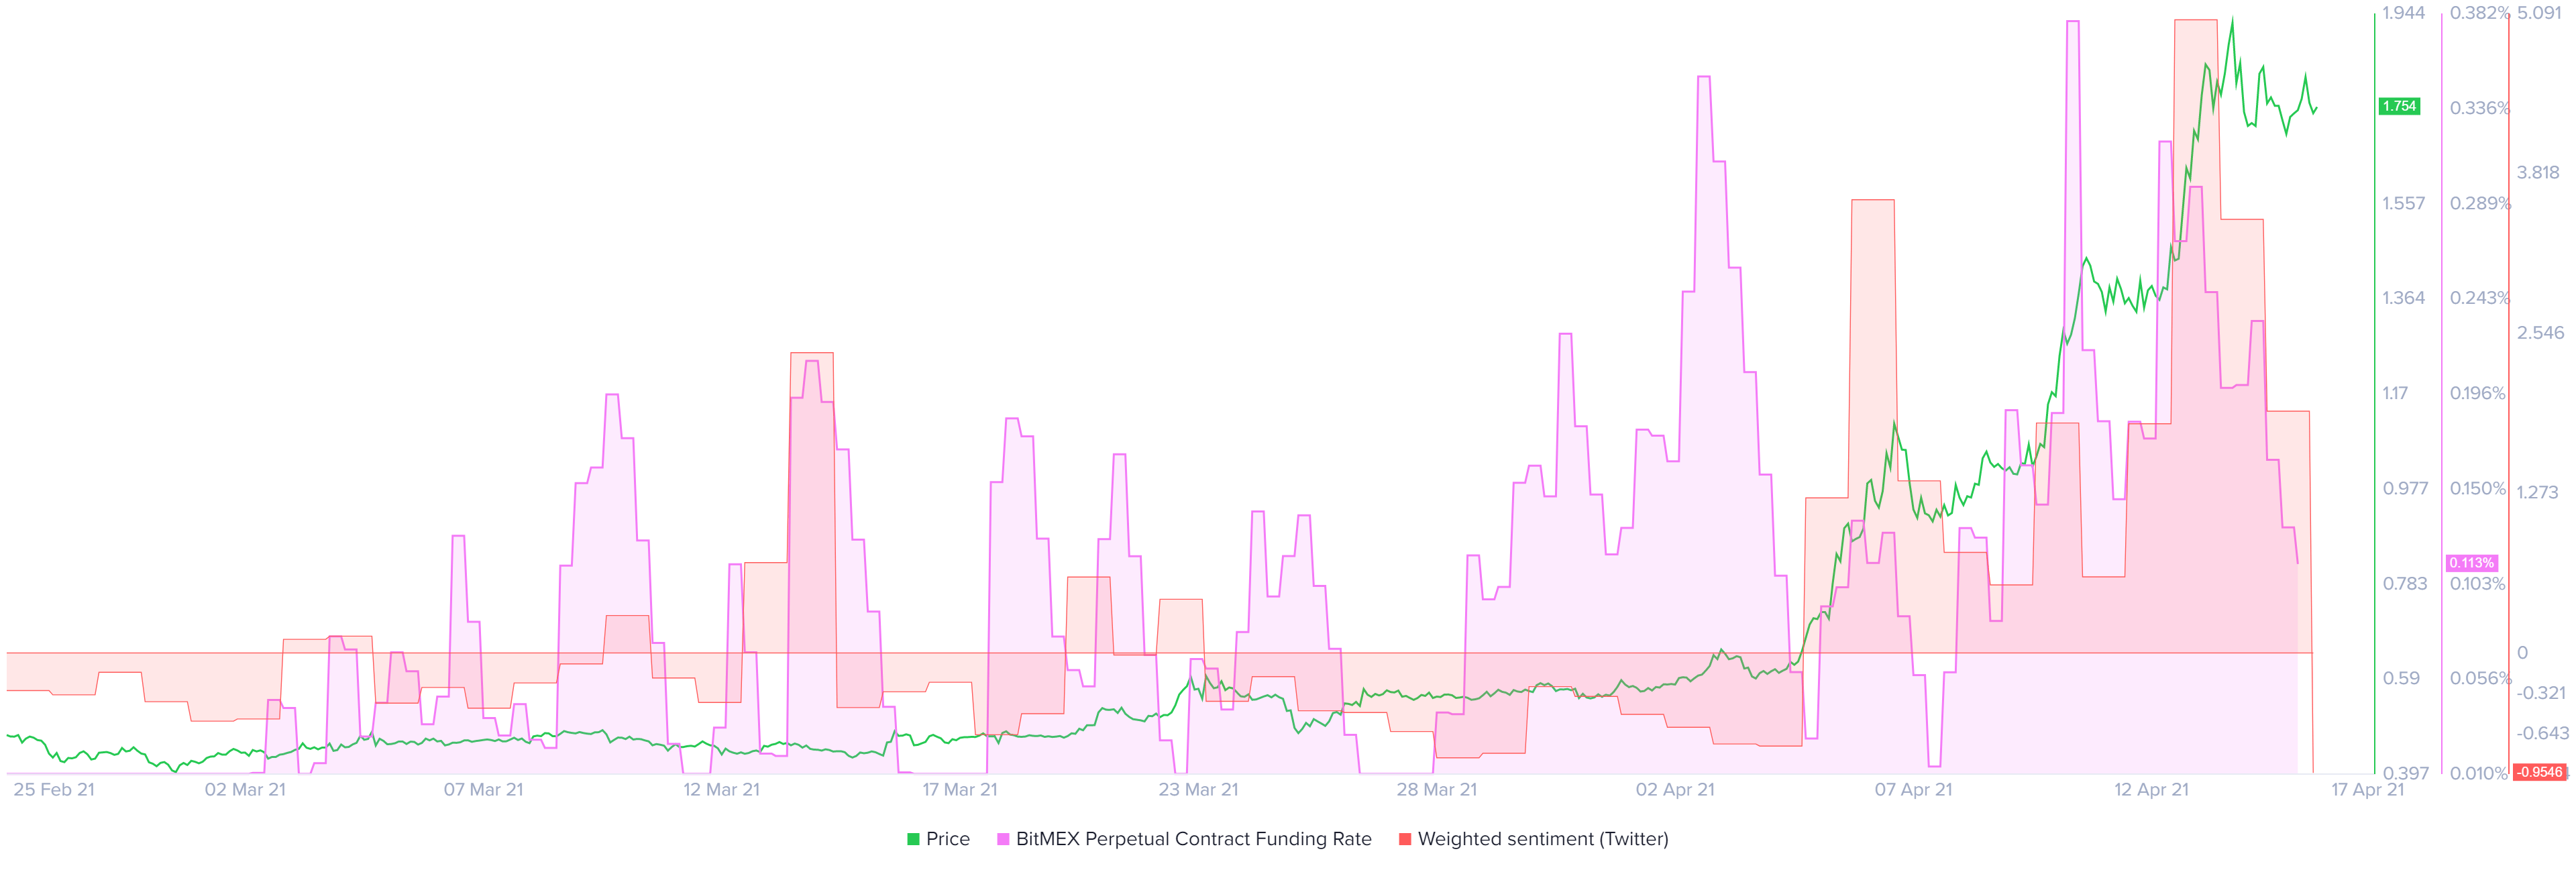
XRP Twitter weighted sentiment, BitMEX funding rate chart
While everything seems to be looking for XRP price, a breakdown of the ascending parallel channel’s lower trend line at $1.70 could put the bullish narrative at risk.
A decisive 4-hour candlestick close below $1.67 will signal the start of a new downtrend. In such a scenario, the Ripple price might drop 12% to $1.45.
Information on these pages contains forward-looking statements that involve risks and uncertainties. Markets and instruments profiled on this page are for informational purposes only and should not in any way come across as a recommendation to buy or sell in these assets. You should do your own thorough research before making any investment decisions. FXStreet does not in any way guarantee that this information is free from mistakes, errors, or material misstatements. It also does not guarantee that this information is of a timely nature. Investing in Open Markets involves a great deal of risk, including the loss of all or a portion of your investment, as well as emotional distress. All risks, losses and costs associated with investing, including total loss of principal, are your responsibility. The views and opinions expressed in this article are those of the authors and do not necessarily reflect the official policy or position of FXStreet nor its advertisers. The author will not be held responsible for information that is found at the end of links posted on this page.
If not otherwise explicitly mentioned in the body of the article, at the time of writing, the author has no position in any stock mentioned in this article and no business relationship with any company mentioned. The author has not received compensation for writing this article, other than from FXStreet.
FXStreet and the author do not provide personalized recommendations. The author makes no representations as to the accuracy, completeness, or suitability of this information. FXStreet and the author will not be liable for any errors, omissions or any losses, injuries or damages arising from this information and its display or use. Errors and omissions excepted.
The author and FXStreet are not registered investment advisors and nothing in this article is intended to be investment advice.
Recommended Content
Editors’ Picks
Bitcoin Weekly Forecast: BTC demand and liquidity conditions remain weak
Bitcoin price has been consolidating between $94,000 and $100,000 since early February. US Bitcoin spot ETF data recorded a total net outflow of $489.60 million until Thursday.
Sonic (prev. FTM) rallies as TVL hits record high and market capitalization surpasses $3.1 billion
Sonic (S), previous Fantom (FTM), rallies over 20% in the last 24 hours and trades around $0.90 at the time of writing on Friday after rising almost 64% this week. The migration of FTM to S token at a 1:1 ratio was completed on January 17.
Top 3 Price Prediction Bitcoin, Ethereum, Ripple: BTC gears up for volatility while ETH and XRP fight to stay afloat
Bitcoin price has been consolidating between $94,000 and $100,000 since early February; this consolidation phase could soon end. Ethereum price shows signs of strength while Ripple price fights to stay afloat.
Crypto Today: BTC tops $98K on US-Russia diplomacy, while NEAR and Bittensor lead AI tokens’ $30B rally
The global crypto market rose 3% on Thursday, adding $45 billion to reach an aggregate market cap of $3.2 trillion. The crypto AI sector witnessed a 15% rally, with Bittensor (TAO) and NEAR emerging as top performers on the day.
Bitcoin: BTC demand and liquidity conditions remain weak
Bitcoin (BTC) price has been consolidating between $94,000 and $100,000 since early February, hovering around $98,000 at the time of writing on Friday.
The Best brokers to trade EUR/USD
SPONSORED Discover the top brokers for trading EUR/USD in 2025. Our list features brokers with competitive spreads, fast execution, and powerful platforms. Whether you're a beginner or an expert, find the right partner to navigate the dynamic Forex market.