XRP Price Forecast: Ripple to continue thrust higher, targets $1.65
- XRP price strikes support at the support framed by the 38.2% Fibonacci retracement at $1.06 and the psychologically important $1.00.
- Ripple defining a symmetrical triangle continuation pattern on the intra-day charts.
- Golden Cross signal looming as the 50-day simple moving average (SMA) approaches the 200-day SMA.

XRP price has spent this week consolidating last week's 65% gain while testing the validity of the support now offered by the psychologically important $1.00 and the 38.2% retracement at $1.06. The consolidation has taken the form of a symmetrical triangle pattern on the intra-day charts, projecting bullish outcomes for Ripple moving forward.
XRP price quietly waits for a resurgence of buyers
XRP price has climbed 160% from the July 20 low to the August 15 high, busting the omnipresent resistance attributed to the inverse head-and-shoulders neckline and the 200-day SMA, and carrying Ripple to the 50% retracement of the April-July cyclical correction at $1.23.
The ongoing consolidation that has followed the extreme overbought reading on the daily Relative Strength Index (RSI) is designing a symmetrical triangle continuation pattern between the 38.2% retracement and the 50% retracement levels.
The measured move of the symmetrical triangle is 22% from the descending trend line, forecasting an XRP price target of $1.54. A test of the measured move target of $1.54 would overcome resistance at the 61.8% extension at $1.40 and place Ripple close to the 78.6% retracement at $1.65.
A breakout from the symmetrical triangle in the next few days would coincide with a bullish Golden Cross pattern on the daily chart, increasing the confidence in the breakout and rally.
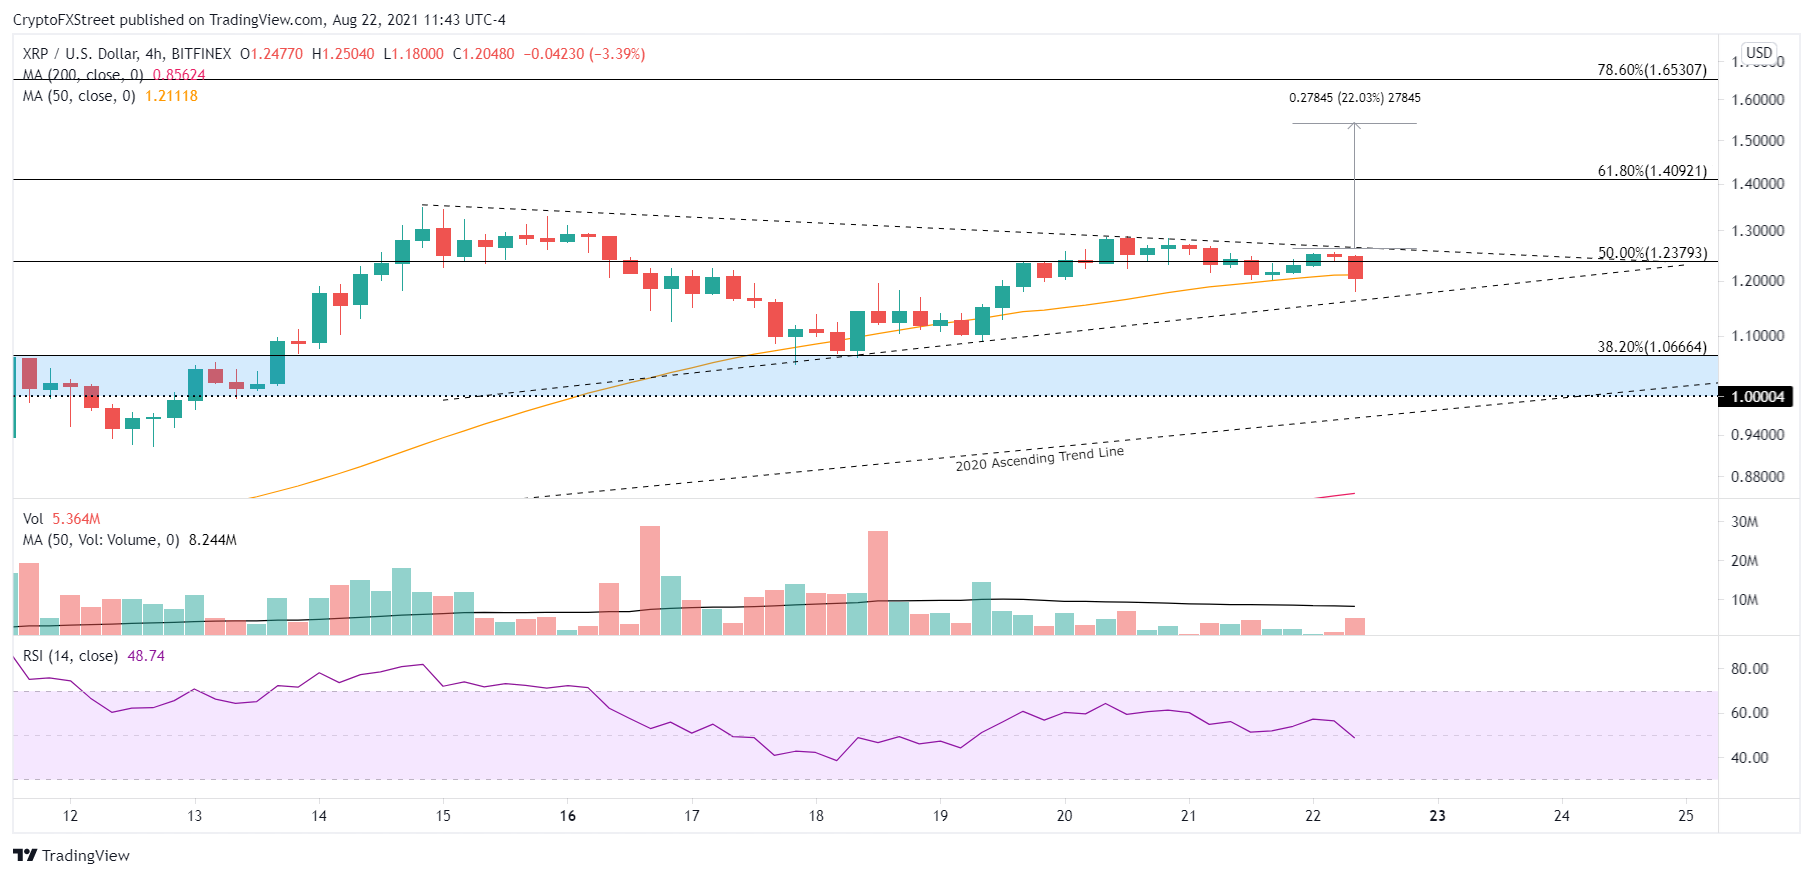
XRP/USD 4-hour chart
As part of the consolidation, Ripple has released some of the price compression generated by the 160% advance. The daily RSI has now fallen out of the overbought territory, creating the space for a new surge of momentum and higher prices.
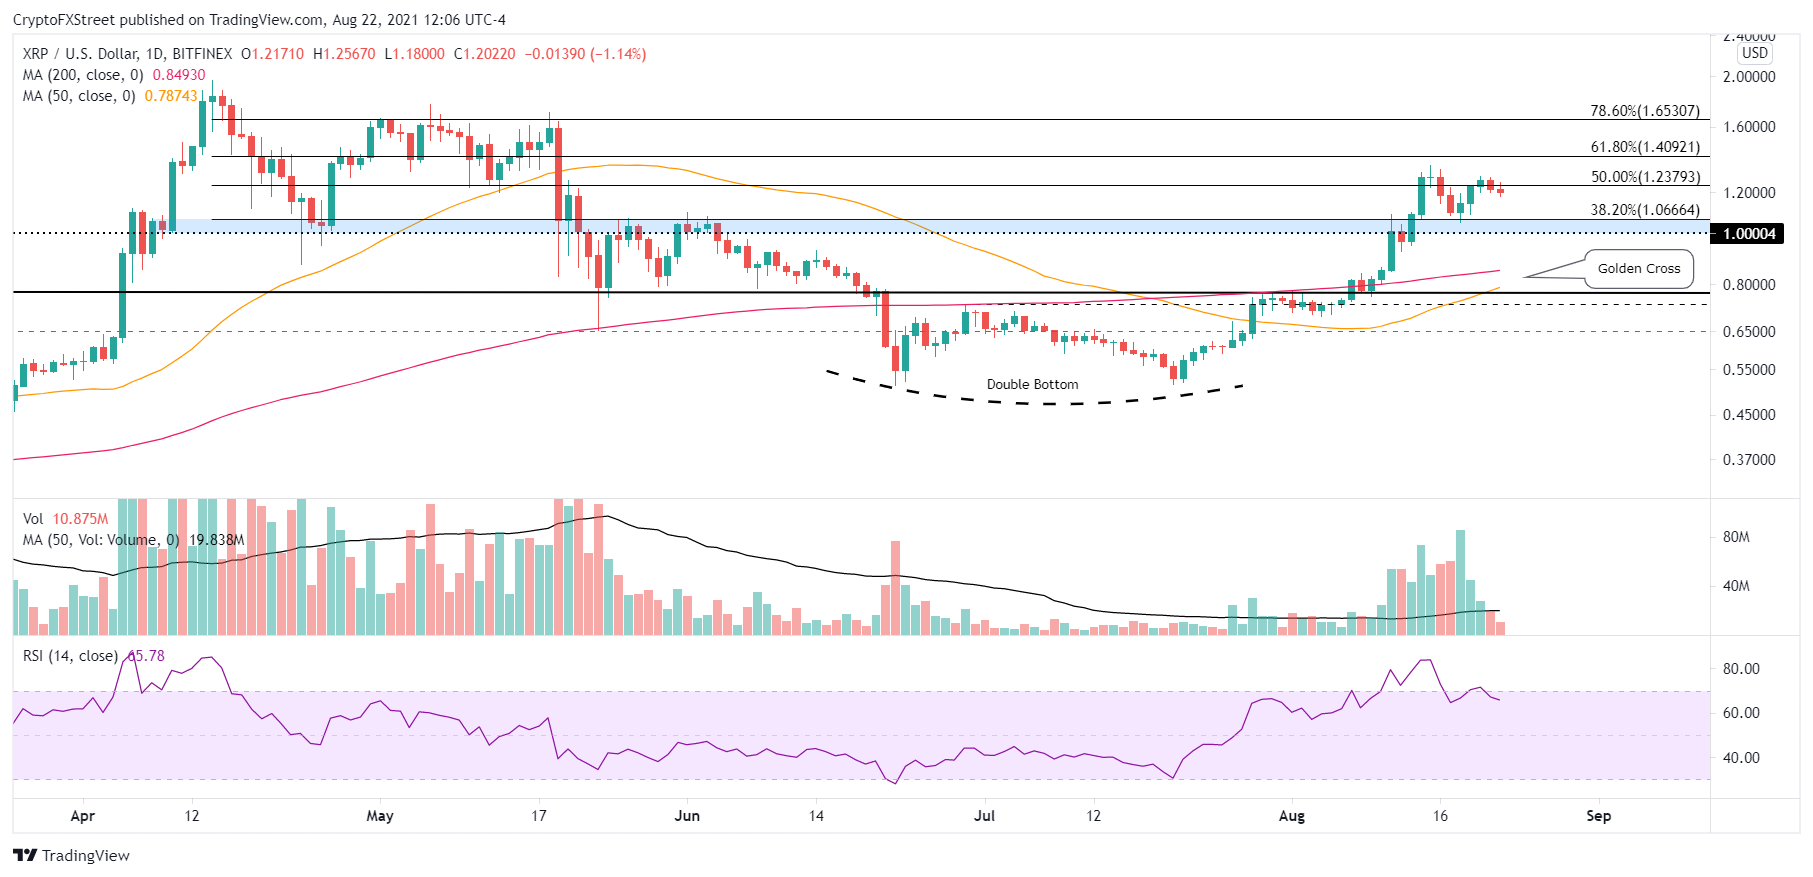
XRP/USD daily chart
Fundamental to the bullish outlook is the strength of the $1.00-$1.06 support. A daily close below the range would introduce a bearish twist that may jeopardize the rally’s sustainability. Downside targets include the 200-day SMA at $0.84 and the 50-day SMA at $0.78.
XRP price continues to flex a bullish posture, discovering support at a crucial support range, releasing price compression and plotting a bullish continuation pattern. The measured move target is $1.54, but based on the persuasiveness of the rally to date, Ripple should have no difficulty reaching $1.65 before a meaningful pullback will materialize.
Here, FXStreet's analysts evaluate where Ripple could be heading next as it seems primed to breakout.
Author

Sheldon McIntyre, CMT
Independent Analyst
Sheldon has 24 years of investment experience holding various positions in companies based in the United States and Chile. His core competencies include BRIC and G-10 equity markets, swing and position trading and technical analysis.


