![]() Sheldon McIntyre, CMT
Sheldon McIntyre, CMT
Independent Analyst
- XRP price shows intense indecision with two weekly doji candlesticks in the last five weeks.
- Tactically important 10-week simple moving average (SMA) still chasing price.
- Weekly Relative Strength Index (RSI) displays a bearish momentum divergence at the April high.
XRP price is shaping a symmetrical triangle pattern that is often considered a continuation pattern, but it can resolve both ways. The emerging pattern offers some clarity to the uneven price action over the last month and solidifies the short-term neutral outlook for the international settlements token.
XRP price turbulence provides mixed signals for investors
Over the last five weeks, XRP price has closed with two doji candlesticks, and Ripple may close with another one this week. The indecision exemplified by the pattern and amplified by the fact it is occurring on a weekly chart presents a challenge for the bullish narrative and an upward resolution to the emerging symmetrical triangle pattern.
The bullish XRP price outlook can be renewed with a rally above the triangle’s upper trend line at $1.67 and a daily close above last week’s doji high at $1.76. The respite from the indecision will put buyers back in control of Ripple and project higher returns for the altcoin.
Immediate resistance upon breakout will be the April high at $1.96, followed closely by the psychologically important $2.00 and the 61.8% Fibonacci retracement of the 2018-2020 decline at $2.08. Combined, the three levels present a formidable challenge for the bullish XRP price narrative.
A successful rally above the area of $2.00 puts XRP price in an excellent position to test the 78.6% retracement of the 2018-2020 decline at $2.61, a gain of 80% from price at the time of writing.
The potential of a positive resolution to the SEC case with Ripple, combined with rumors of an IPO following the case, has many investors focused on the all-time high at $3.30. It has been proven this year by other cryptocurrencies that all-time highs can be a powerful magnet for price.
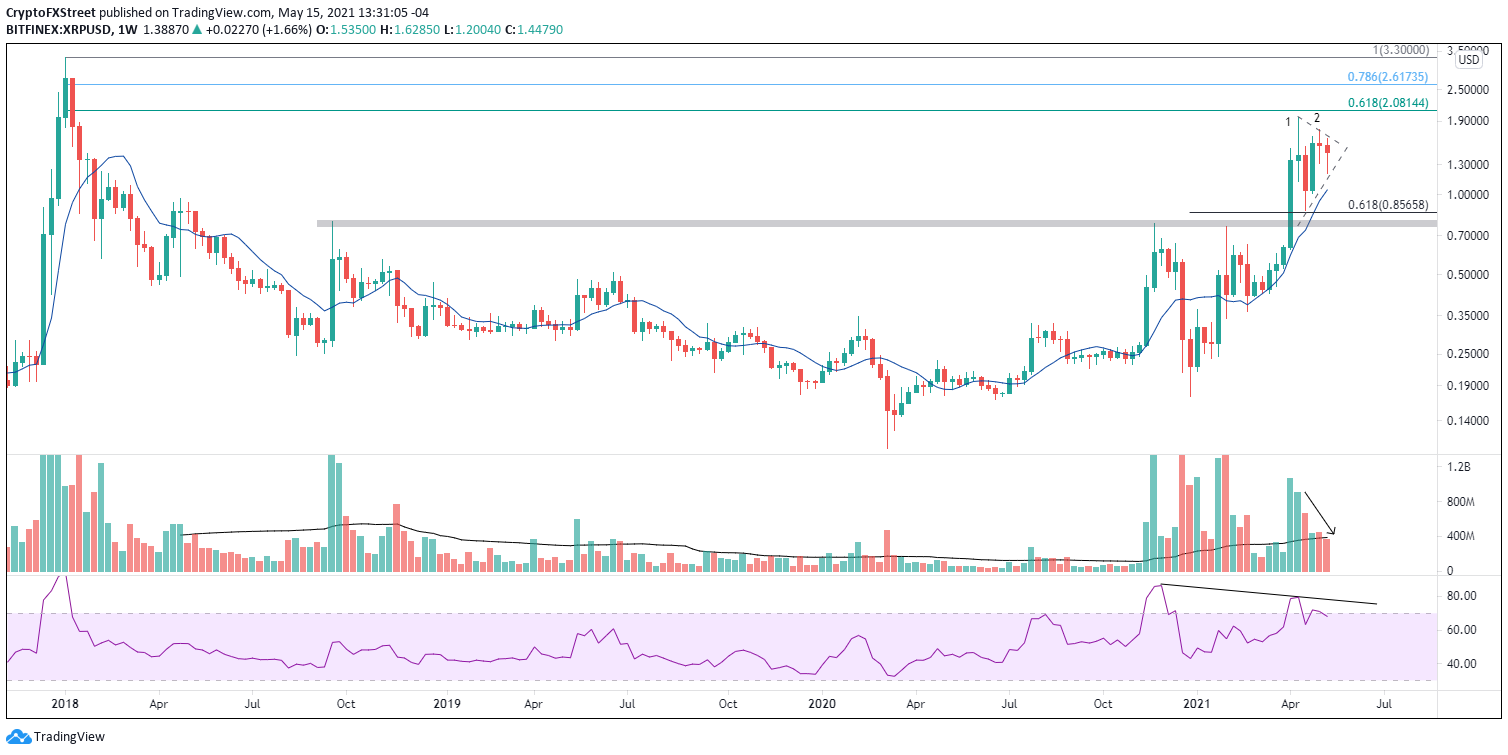
XRP/USD weekly chart
The bearish alternative for Ripple begins with a break below the triangle’s lower trend line at $1.14. Still, the downside could be limited by the tactically important 10-week simple moving average (SMA) at $1.04 and then the critically important $1.00.
Note: All information on this page is subject to change. The use of this website constitutes acceptance of our user agreement. Please read our privacy policy and legal disclaimer. Opinions expressed at FXstreet.com are those of the individual authors and do not necessarily represent the opinion of FXstreet.com or its management. Risk Disclosure: Trading foreign exchange on margin carries a high level of risk, and may not be suitable for all investors. The high degree of leverage can work against you as well as for you. Before deciding to invest in foreign exchange you should carefully consider your investment objectives, level of experience, and risk appetite. The possibility exists that you could sustain a loss of some or all of your initial investment and therefore you should not invest money that you cannot afford to lose. You should be aware of all the risks associated with foreign exchange trading, and seek advice from an independent financial advisor if you have any doubts.
Recommended Content
Editors’ Picks

Grayscale files S-3 form for Digital Large Cap ETF comprising Bitcoin, Ethereum, XRP, Solana, and Cardano
Grayscale, a leading digital asset manager operating the GBTC ETF, has filed the S-3 form with the United States (US) Securities and Exchange Commission (SEC) in favor of a Digital Large Cap ETF.

Top 3 Price Prediction Bitcoin, Ethereum, Ripple: BTC, ETH, and XRP brace for volatility amid Trump’s ‘Liberation Day’
Bitcoin price faces a slight rejection around its $85,000 resistance level on Wednesday after recovering 3.16% the previous day. Ripple follows BTC as it falls below its critical level, indicating weakness and a correction on the horizon.

Top crypto news: VanEck hints at BNB ETF, Circle files S-1 application for IPO
Asset manager VanEck registered a BNB Trust in Delaware on Tuesday, marking its intention to register for an ETF product with the Securities & Exchange Commission (SEC).

Solana Price Forecast for April 2025: SOL traders risk $120 reversal as FTX begins $800M repayments on May 30
Solana price consolidated below $130 on Tuesday, facing mounting headwinds in April as investors grow wary of looming FTX sell-offs.

Bitcoin: BTC remains calm before a storm
Bitcoin's price has been consolidating between $85,000 and $88,000 this week. A K33 report explains how the markets are relatively calm and shaping up for volatility as traders absorb the tariff announcements. PlanB’s S2F model shows that Bitcoin looks extremely undervalued compared to Gold and the housing market.

The Best brokers to trade EUR/USD
SPONSORED Discover the top brokers for trading EUR/USD in 2025. Our list features brokers with competitive spreads, fast execution, and powerful platforms. Whether you're a beginner or an expert, find the right partner to navigate the dynamic Forex market.