XRP Elliott Wave technical analysis [Video]
![XRP Elliott Wave technical analysis [Video]](https://editorial.fxstreet.com/images/Markets/Currencies/Cryptocurrencies/Coins/Ripple/Ripple_Watch_XtraLarge.jpg)
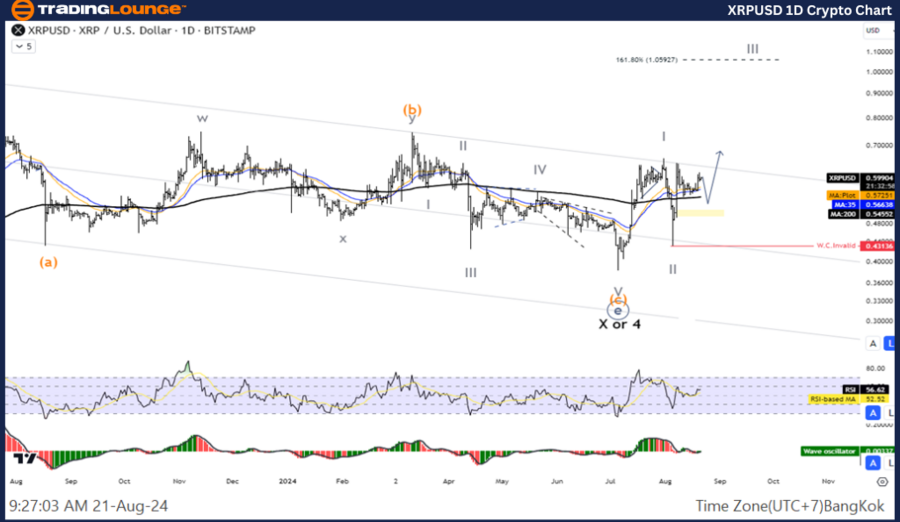
XRP/USD Elliott Wave technical analysis
Function: Follow Trend.
Mode: Motive.
Structure: Impulse.
Position: Wave III.
Direction Next higher Degrees: Wave I of Impulse.
Details: the five-wave Increase of wave III.
XRP/ U.S. dollar (XRPUSD) Trading Strategy: Overall, the correction seems to be coming to an end. Look for an opportunity to join the uptrend from a short-term correction within.
XRP/ U.S. dollar (XRPUSD) Technical Indicators: The price is above the MA200 indicating an Uptrend, The Wave Oscillator is a Bullish Momentum.
XRP/USD one-day chart
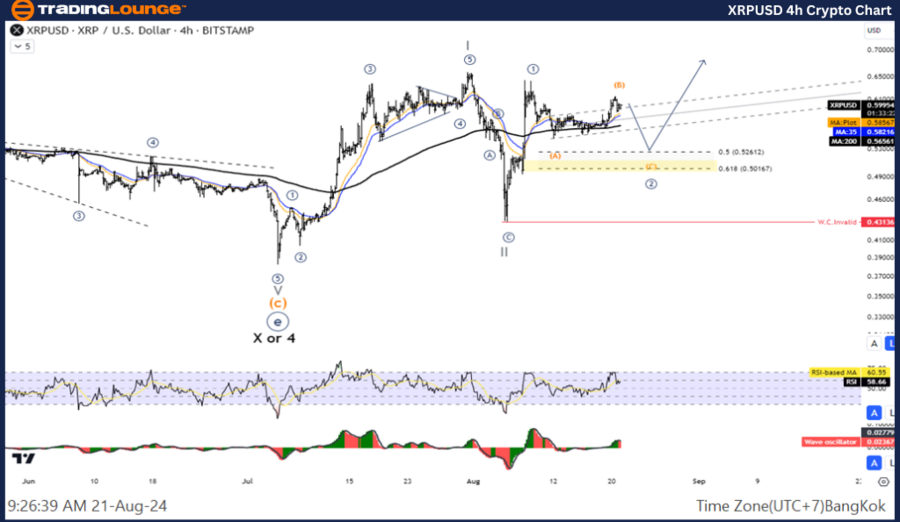
XRP/USD Elliott Wave technical analysis
Function: Follow Trend
Mode: Motive
Structure: Impulse
Position: Wave III
Direction next higher degrees: Wave I of Impulse
Details: The five-wave Increase of wave III
XRP/ U.S. dollar (XRP/USD) Trading Strategy: ChainLink overall is still in the period of correction. In the position of wave (II) with a double corrective pattern, the view is therefore for a short-term pullback before rising again in wave (III), waiting for the correction to complete to rejoin the uptrend.
XRP/ U.S. dollar (XRP/USD)Technical Indicators: The price is above the MA200 indicating an Uptrend, The Wave Oscillator is a Bullish Momentum.
XRP Elliott Wave technical analysis [Video]
Author

Peter Mathers
TradingLounge
Peter Mathers started actively trading in 1982. He began his career at Hoei and Shoin, a Japanese futures trading company.


