XLM price turns lower, suggests Stellar buy signal was temporary
- XLM price emergence from a symmetrical triangle is quickly extinguished by channel resistance.
- Consecutive inside bars on the 12-hour chart generates price expansion to the downside.
- Smoothed social volume metric sits at the lowest level since January.

XLM price has been trending higher, but the rejection at the channel’s lower trend line has put Stellar on the cusp of another leg lower. If the current support cannot hold, the digital asset will be unprotected from potentially revisiting the May lows.
XLM price loses opportunity to commence a meaningful uptrend
On May 19, XLM price sliced through the 50-day SMA, the channel’s lower trend line and the 200-day SMA, removing the weakest of holders and most prominent pockets of anxiety. The response was a 50% rebound for Stellar and a close above the channel’s lower trend line.
The moment of relief proved short-lived as XLM price plummeted below the May 19 low, evacuating the investors that bought the dip and effectively preparing Stellar to begin defining an actionable bottom.
From May 20 until May 30, XLM price formed a symmetrical triangle that resolved to the upside on May 31 and was followed by a bullish engulfing bar. However, the breakout could not survive the ascending channel’s lower trend line and evolved into a tight consolidation for two days, highlighted by consecutive inside bars on the 12-hour chart.
Today, XLM price resolved the price contraction with price expansion to the downside that carried Stellar down to the 200-day SMA at $0.368. The cryptocurrency has rebounded slightly but still shows an 8% loss at the time of writing.
Despite the bearish developments, XLM price breakout remains live with a measured move target of $0.591, representing a 47% gain from the original trigger price of $0.403. A resumption of the ascent will obviously meet aggressive resistance at the channel’s lower trend line now at $0.453. The next resistance is the intersection of the 38.2% Fibonacci extension at $0.474 with the 200 twelve-hour SMA at $0.478.
Further resistance emerges at the 50 twelve-hour SMA at 0.499, followed by the 50% retracement at $0.536. If successful, Stellar may reach the measured move target of $0.591, which comes very close to the 61.8% retracement level at $0.597.
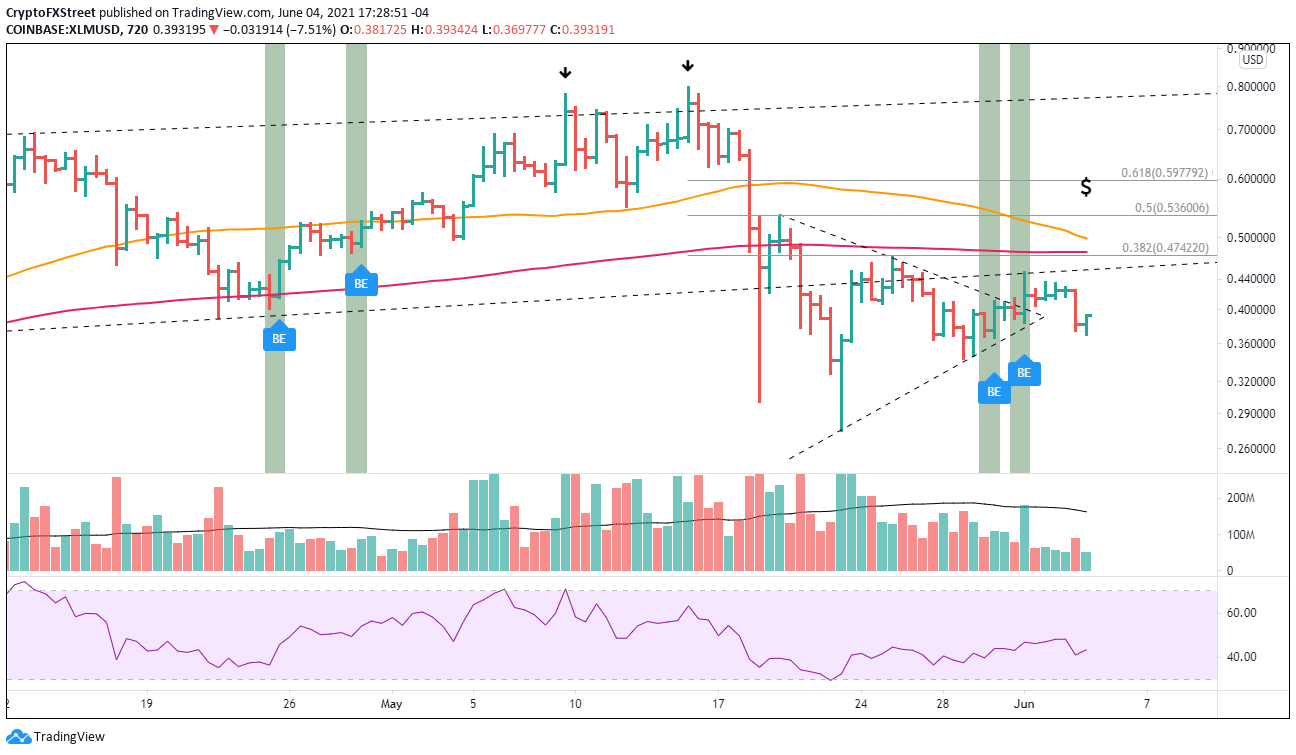
XLM/USD 12-hour chart
Since XLM price did not emerge from the triangle until it was close to the apex, it lowers the probability that the breakout will yield a notable gain moving forward. In light of that development combined with the suffocating resistance, Stellar could quickly reverse to the downside if crypto sentiment deteriorates.
Substantial support is at the May 29 low at $0.343. A failure to hold the price level leaves XLM price vulnerable to a test of the May 19 low at $0.300 and potentially the May 19 low at $0.274, yielding a 35% decline from the current price.
Sentiment should always be considered a secondary indicator. Still, it is relevant to note that the Santiment social volume metric, on a smooth basis, is positioned at the same level that preceded the sharp rally to begin 2021 and the late January spike.
As a timing tool, it seems to have nominal value. Still, in the broader scheme, it does exhibit that the rebound off the May 23 low has not captured the attention of 1000+ crypto social media channels, Telegram groups, crypto subreddits, discord groups or private traders chats. To be blunt, Stellar is not a the forefront of retail investor interest, suggesting that the rally still lacks the energy to best the areas of resistance discussed above.
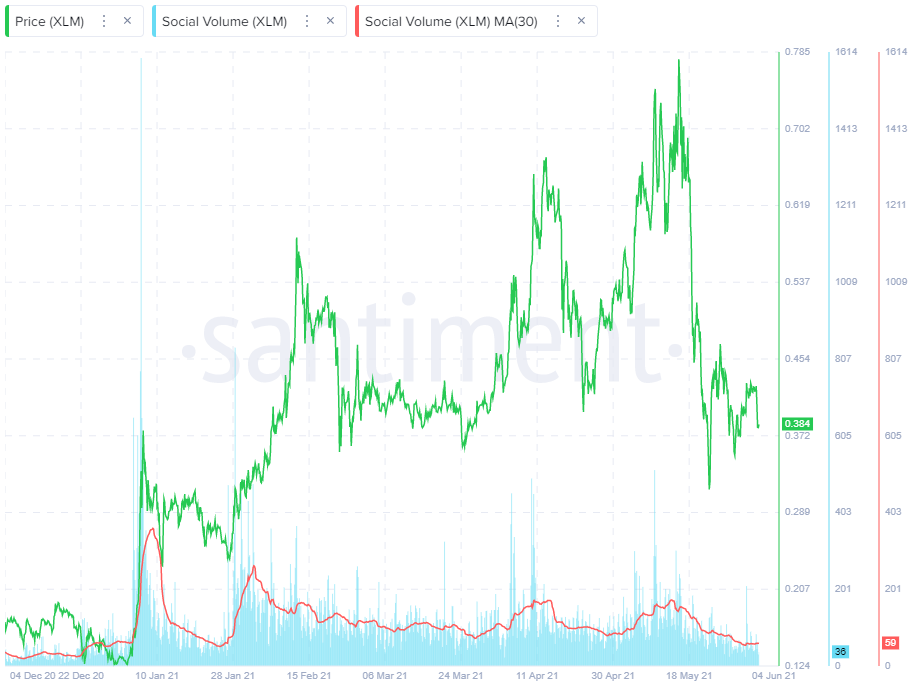
XLM Social Volume - Santiment
Stellar remains in an uptrend as long as XLM price remains above the May 29 low at $0.343. Nevertheless, the weight of the charts is exposing problems with a bullish outlook. Investors should remain attentive to key price levels, use daily closes to confirm price action and direction, and be alert to the approaching death cross on the 12-hour chart.
Author

Sheldon McIntyre, CMT
Independent Analyst
Sheldon has 24 years of investment experience holding various positions in companies based in the United States and Chile. His core competencies include BRIC and G-10 equity markets, swing and position trading and technical analysis.


