![]() Jonathan Morgan
Jonathan Morgan
Independent Analyst
- XLM price recovered all of the losses it experienced last week.
- Buyers bought all dips and continue to support XLM against any sell-off.
- Trapped short-sellers could become major catalysts to any upcoming rally.
XLM price continues to consolidate, but it may be nearing a fantastic bullish breakout zone ahead. The combination of a conversion to a bull market and the anticipated break of an inverse head-and-shoulders pattern has buyers waiting for confirmation before entering any long trades.
XLM price positioned for monster bullish bullish breakout if it can hit $0.41
XLM price presents two trade ideas for the long and short sides of the market. The first trade idea is a hypothetical buy stop at $0.41, a stop loss at $0.37 and a profit target at $0.55. This trade idea would accomplish two primary goals. First, it would confirm the conversion to a bull market by entering above the first pull-back zone. Second, it would deny the bear flag as a bearish continuation pattern, creating a sort of bear trap.
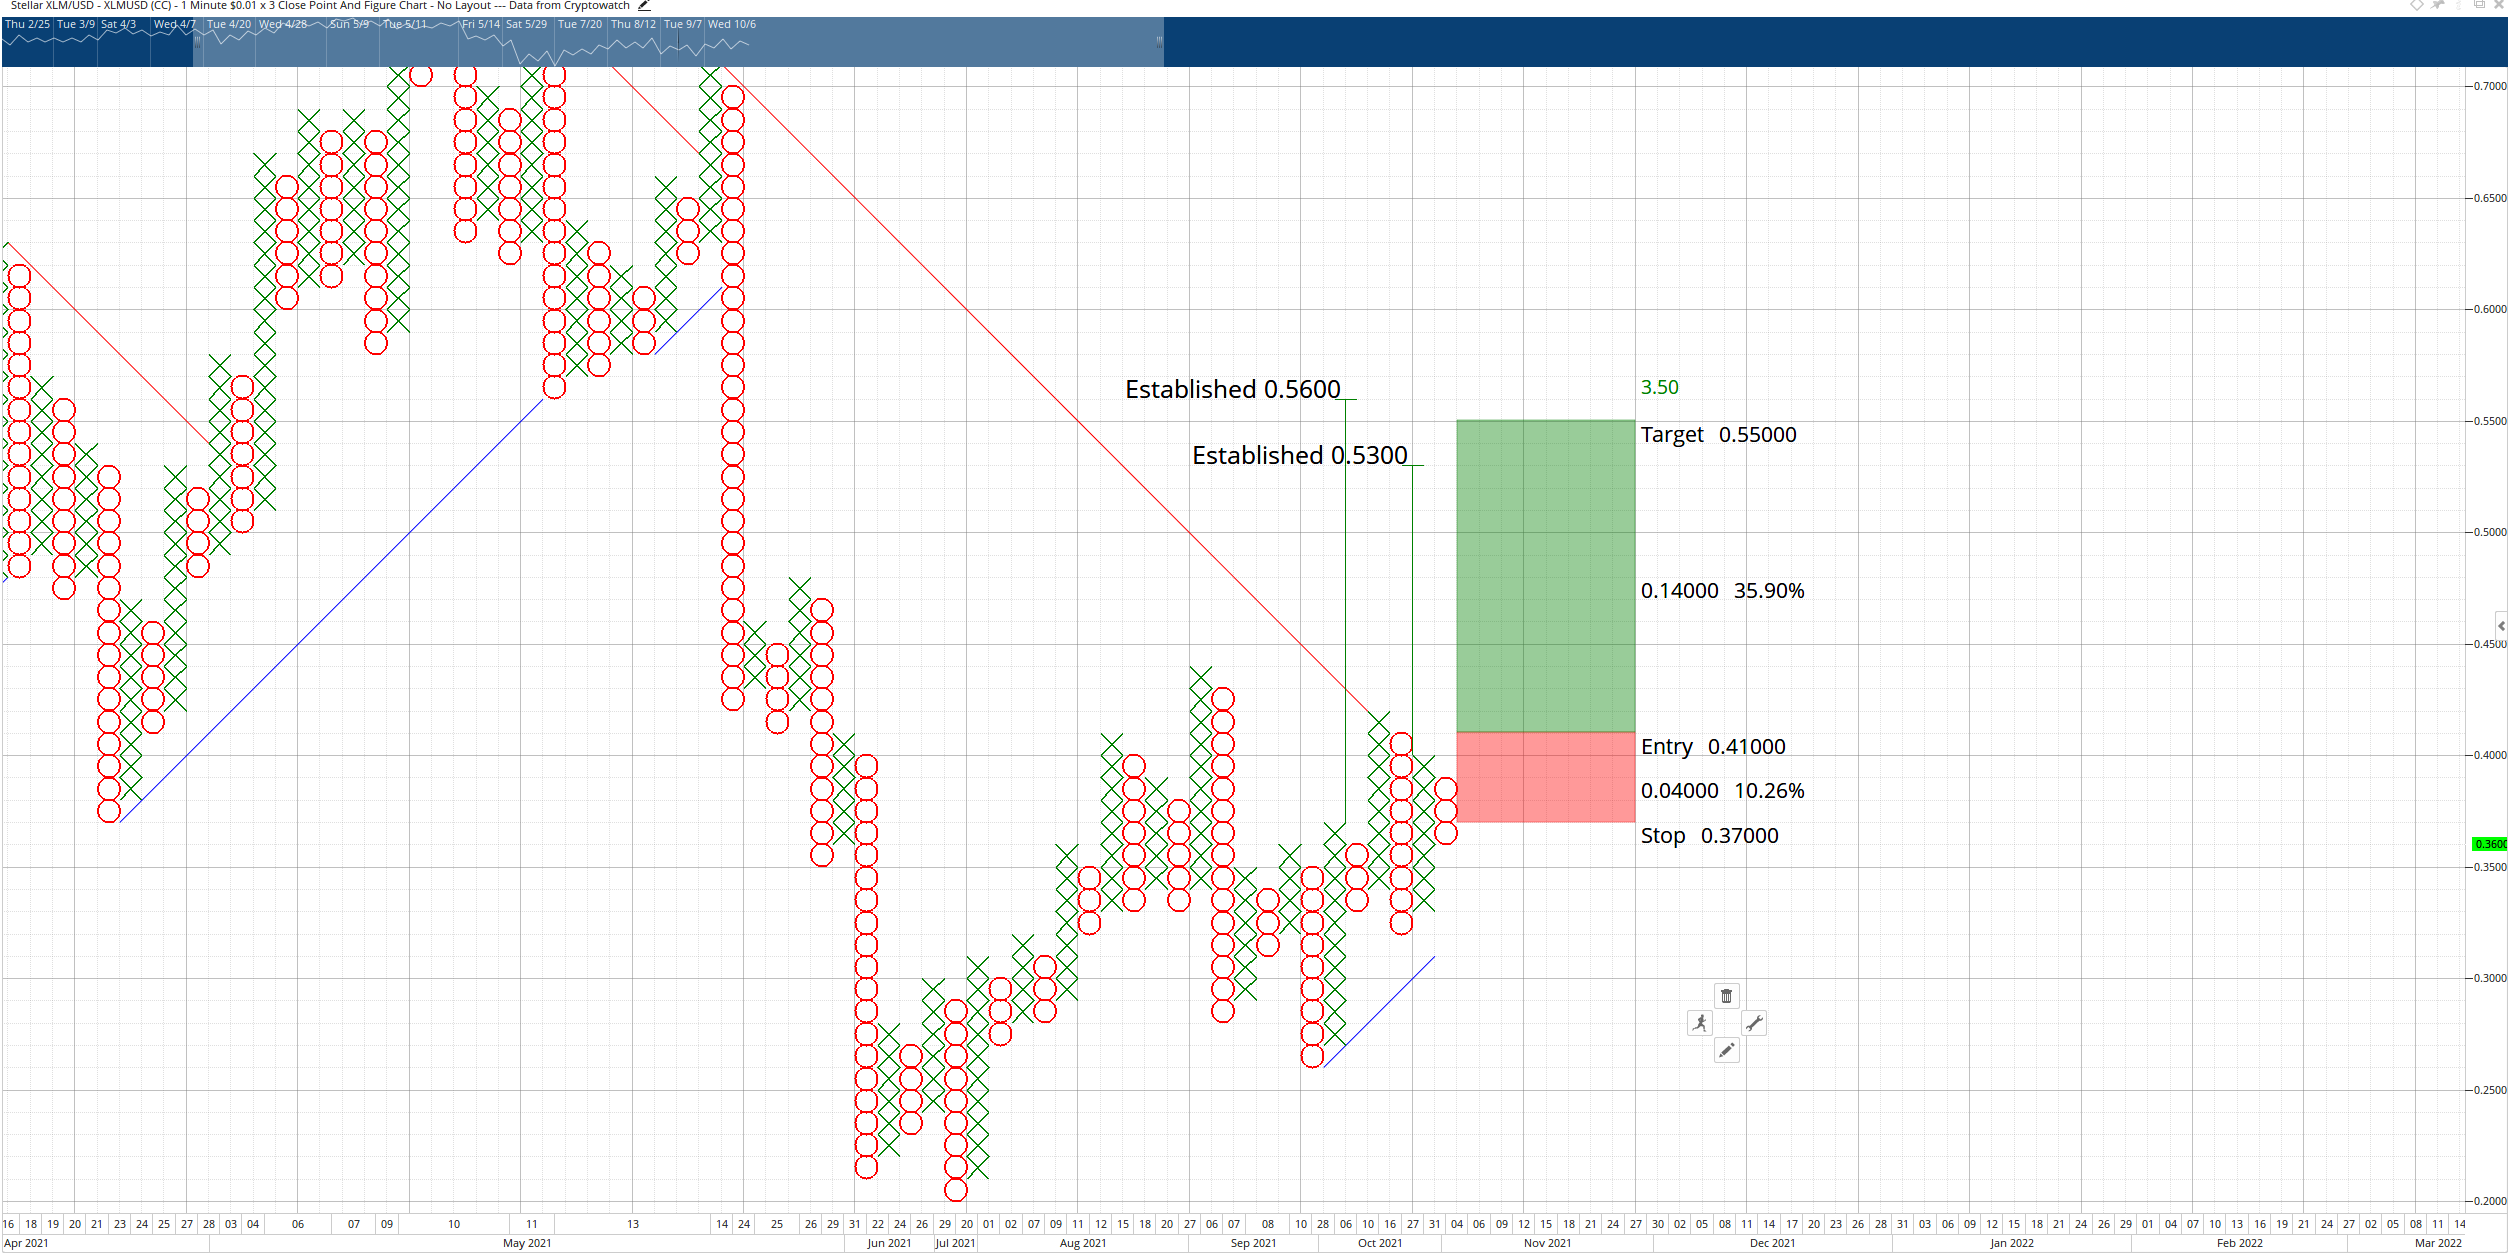
XLM/USD $0.01/3-box Reversal Point and Figure Chart
The long trade idea would be invalidated if the XLM were to drop below $0.31.
The short side of the trade is a little tricker and requires more active management of the trade. If the current column of Os dropped to a double bottom at $0.32, XLM price might find support at a high volume node in the volume profile and the dominant bull market angle (blue diagonal line). Therefore, developing a triple-bottom or a split triple-bottom at $0.32 would be necessary for a hypothetical short entry at $0.31. The short entry idea is a sell stop at $0.31, a stop loss at $0.34 and a profit target at $0.20 – again, only if there is a triple-bottom or split-triple bottom.
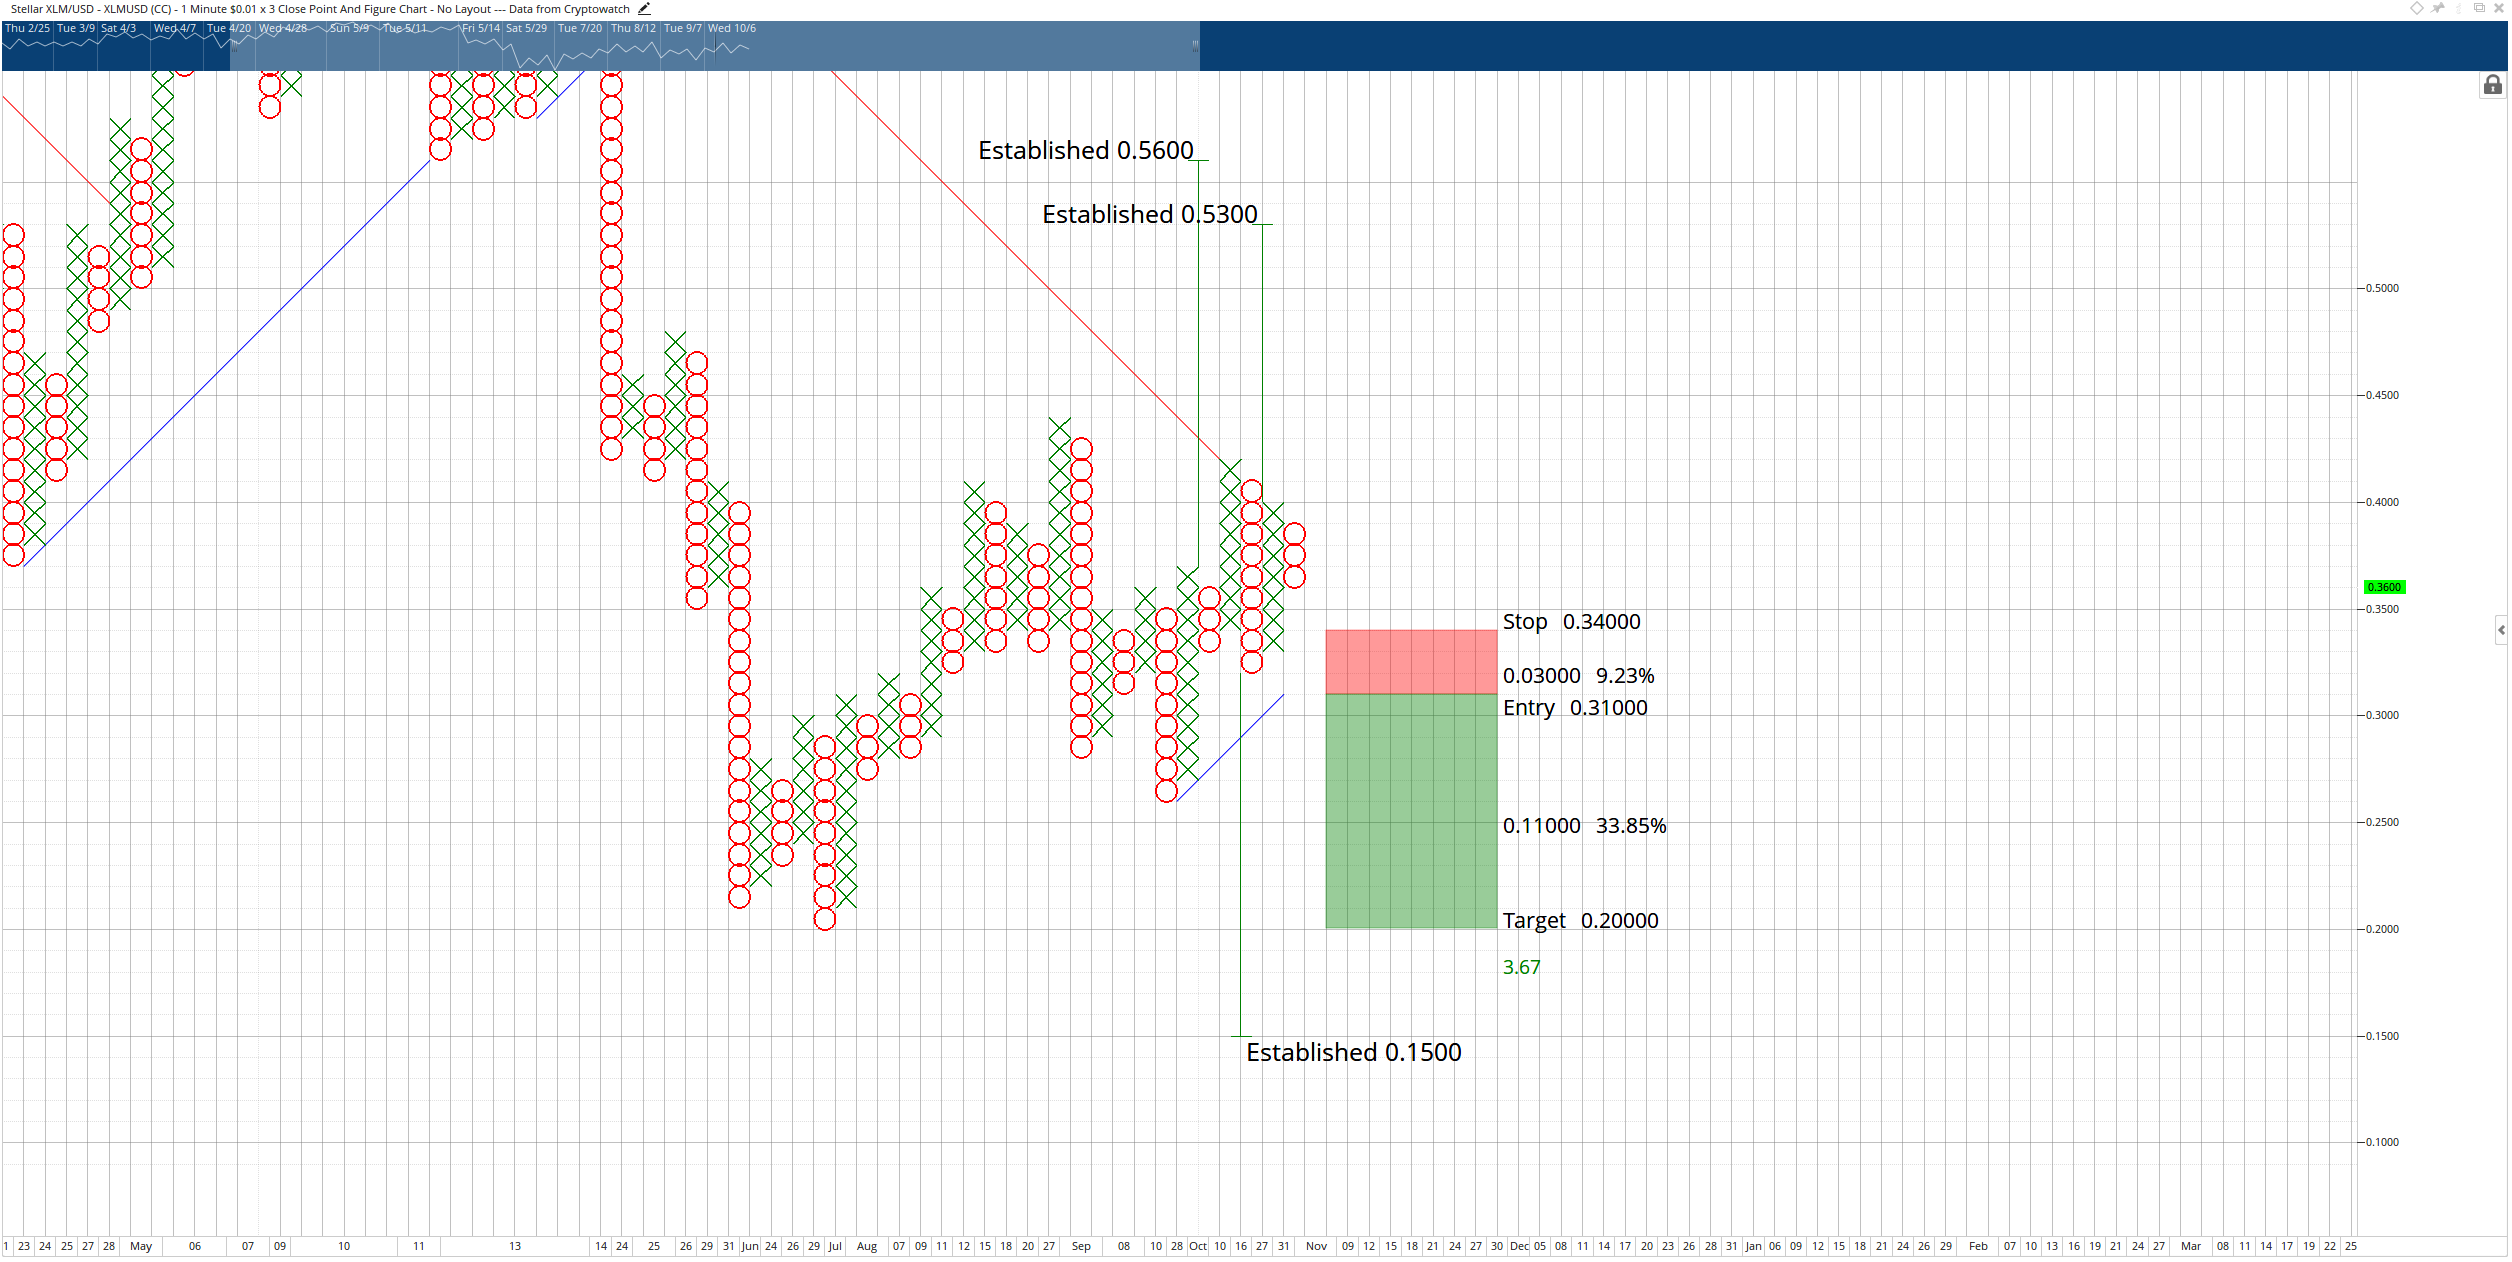
XLM/USD $0.01/3-box Reversal Point and Figure Chart
However, the short idea is the least likely to occur. The Vertical Profit Target Method indicates that the profit zone is at $0.15 – but that has a very low probability of occurring. It is more likely that the lows on any sell-off would be limited to the Volume Point of Control for 2021 and the prior support zone at the $0.20 value area. The theoretical short idea will be invalidated if the long trade above is activated.
Note: All information on this page is subject to change. The use of this website constitutes acceptance of our user agreement. Please read our privacy policy and legal disclaimer. Opinions expressed at FXstreet.com are those of the individual authors and do not necessarily represent the opinion of FXstreet.com or its management. Risk Disclosure: Trading foreign exchange on margin carries a high level of risk, and may not be suitable for all investors. The high degree of leverage can work against you as well as for you. Before deciding to invest in foreign exchange you should carefully consider your investment objectives, level of experience, and risk appetite. The possibility exists that you could sustain a loss of some or all of your initial investment and therefore you should not invest money that you cannot afford to lose. You should be aware of all the risks associated with foreign exchange trading, and seek advice from an independent financial advisor if you have any doubts.
Recommended Content
Editors’ Picks

Shiba Inu eyes positive returns in April as SHIB price inches towards $0.000015
Shiba Inu's on-chain metrics reveal robust adoption, as addresses with balances surge to 1.4 million. Shiba Inu's returns stand at a solid 14.4% so far in April, poised to snap a three-month bearish trend from earlier this year.

AI tokens TAO, FET, AI16Z surge despite NVIDIA excluding crypto-related projects from its Inception program
AI tokens, including Bittensor and Artificial Superintelligence Alliance, climbed this week, with ai16z still extending gains at the time of writing on Friday. The uptick in prices of AI tokens reflects a broader bullish sentiment across the cryptocurrency market.

Bitcoin Weekly Forecast: BTC consolidates after posting over 10% weekly surge
Bitcoin price is consolidating around $94,000 at the time of writing on Friday, holding onto the recent 10% increase seen earlier this week. This week’s rally was supported by strong institutional demand, as US spot ETFs recorded a total inflow of $2.68 billion until Thursday.

XRP price could renew 25% breakout bid on surging institutional and retail adoption
Ripple price consolidates, trading at $2.18 at the time of writing on Friday, following mid-week gains to $2.30. The rejection from this weekly high led to the price of XRP dropping to the previous day’s low at $2.11, followed by a minor reversal.
Bitcoin Weekly Forecast: BTC consolidates after posting over 10% weekly surge
Bitcoin (BTC) price is consolidating around $94,000 at the time of writing on Friday, holding onto the recent 10% increase seen earlier this week.

The Best brokers to trade EUR/USD
SPONSORED Discover the top brokers for trading EUR/USD in 2025. Our list features brokers with competitive spreads, fast execution, and powerful platforms. Whether you're a beginner or an expert, find the right partner to navigate the dynamic Forex market.