XLM Price Prediction: Stellar upside challenged by stealthy indicator
- XLM price claims 50-week simple moving average (SMA) with upside contained by the Anchored VWAP from March 2020.
- Stellar triggers a double bottom pattern on August 7 with a daily close above the June 29 high of $0.293.
- The 44% rally over the last 21 sessions has activated a bullish Golden Cross on the nine-hour chart.

XLM price has gained 44% since July 21 and is currently showing a monthly gain of 7.39% while closing last week above the 50-week SMA. The rally has been gradual, instructed by an ascending parallel channel since the rumors of a Stellar bid for MoneyGram on July 22, and now the Anchored VWAP from March 2020 is disrupting the momentum. The Anchored VWAP may limit the upside and introduce a correction, but XLM price should tag the measured move target of $0.388 in the coming weeks.
XLM price lacks impulsiveness, but the uptrend is solid
XLM price has been rising in an ascending parallel channel since July 23 while breaking above the 50-day SMA and triggering a double bottom pattern on August 7. The bullish but contained Stellar rally was reinforced by the activation of a bullish Golden Cross pattern on the nine-hour chart yesterday. The last Golden Cross was in April, before the spike higher and before that, in late October 2020, followed by the historic rally into the 2021 high.
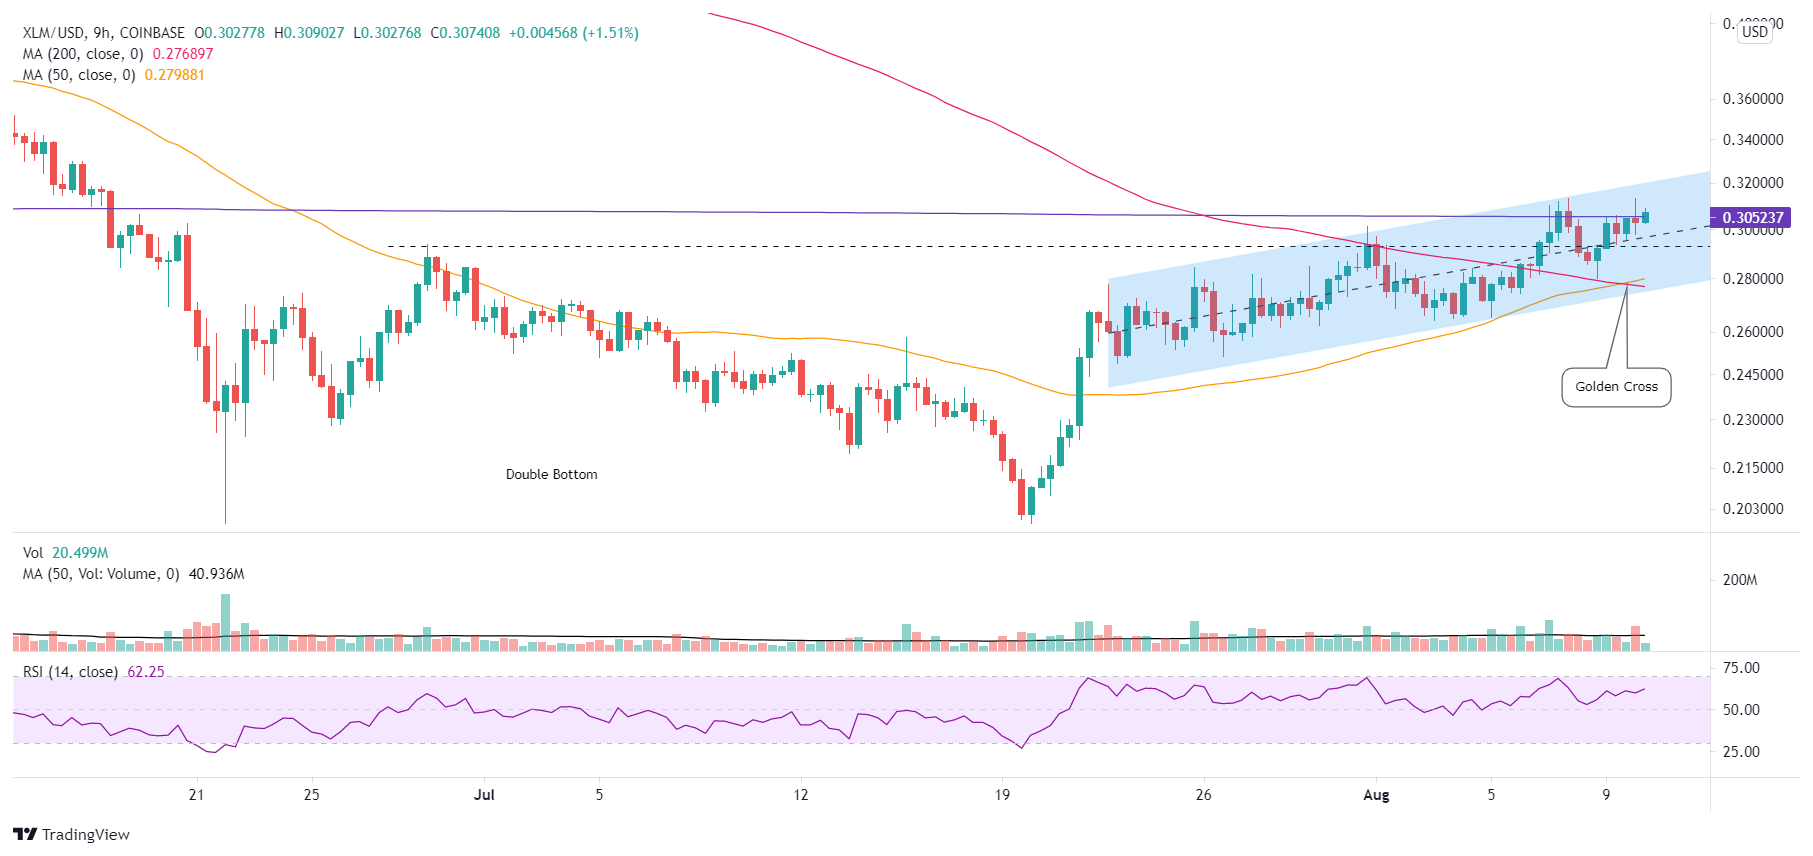
XLM/USD 9-hour chart
To continue the rally, XLM price needs to overcome the stubborn resistance formed by the Anchored VWAP from March 2020 at $0.305 and the upper line of the ascending parallel channel with a daily close above $0.316. If achieved, Stellar would be released to pursue a test of the double bottom measured move price target of $0.388 and the 200-day SMA at $0.397, yielding a 26% return from the upper line of the channel at $0.316.
Suppose the Stellar rally gains momentum after the resistance breakout. In that case, it could drive XLM price to the 38.2% Fibonacci retracement of the May-June correction at $0.427 before transitioning into some corrective process. The 38.2% retracement level is strengthened by a range of price congestion in late May and early June.
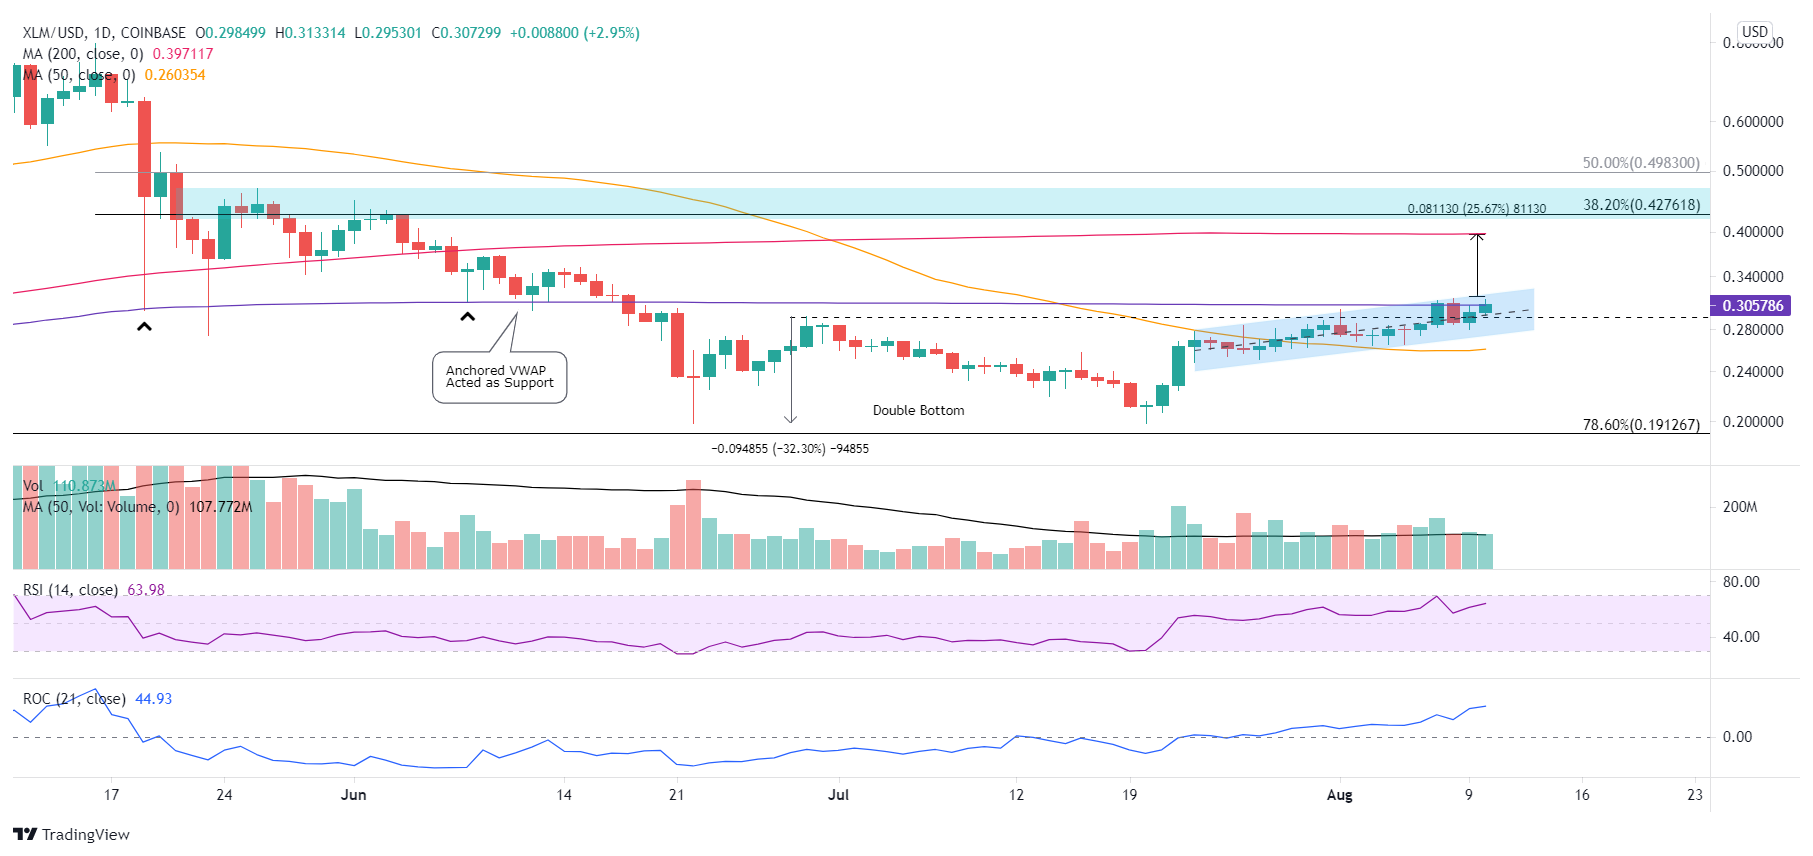
XLM/USD daily chart
A failure of XLM price to climb over the Anchored VWAP and the channel’s upper line could initiate a pullback. Still, Stellar is immediately supported by the double bottom trigger price of $0.293. Below the double bottom trigger is the lower line of the ascending parallel channel around $0.273 and the tactically important 50-day SMA at $0.260.
Any further downside would disrupt the bullish price structure and propose an alternative outlook for XLM price, including a return to the July 20 low of $0.199. At this point, it is a low probability scenario for Stellar.
As long as XLM price is entangled with the Anchored VWAP at $0.305, Stellar investors need to be patient and even factor in some retracement to reset the price structure for better prices. Nonetheless, XLM price has established an important low that should not be tested moving forward.
Author

Sheldon McIntyre, CMT
Independent Analyst
Sheldon has 24 years of investment experience holding various positions in companies based in the United States and Chile. His core competencies include BRIC and G-10 equity markets, swing and position trading and technical analysis.


