• XLM price could be on the verge of a major correction, according to various indicators.
  • The funding rates for Stellar are significantly overextended across all big exchanges.
  • The digital asset faces a lot of selling pressure after a notable rejection.

XLM price has experienced a massive 60% rally in the past two weeks, cracking the previous all-time high of $0.60 established on February 13. However, Stellar did not get any continuation moves above this point, and it is trading at $0.581 at the time of writing. 

Stellar funding rates are a concerning indicator

Funding rates are periodic payments that long or short traders have to pay based on the difference between the perpetual contract market and spot market. Basically, if the funding rate is positive, long traders have to literally pay short traders and vice versa. 

The current XLM funding rates are extremely overextended at 0.25% on Binance and as high as 0.29% on Huobi. Several analysts think that funding rates of 0.1% or above are significant. Stellar's rates are higher than 0.1% across Binance, FTX, Huobi and Okex, according to Viewbase metrics. 

These rates indicate that long traders have to pay a lot to maintain their positions open. Considering that XLM price increased by 60% in recent weeks, long traders are now more likely to take profits. Similarly, any trader looking to buy would most likely think twice because of the high funding rates. 

Although a trader should not use funding rates alone to open a position, this metric can be extremely useful in combination with technical analysis and other on-chain metrics.

XLM price got rejected at a key resistance level

On the 4-hour chart, XLM price has formed an ascending broadening wedge pattern, drawn by connecting the higher highs and higher lows with two trend lines that spread out. Stellar got rejected at $0.654 from the upper boundary of the pattern. 

xlm price

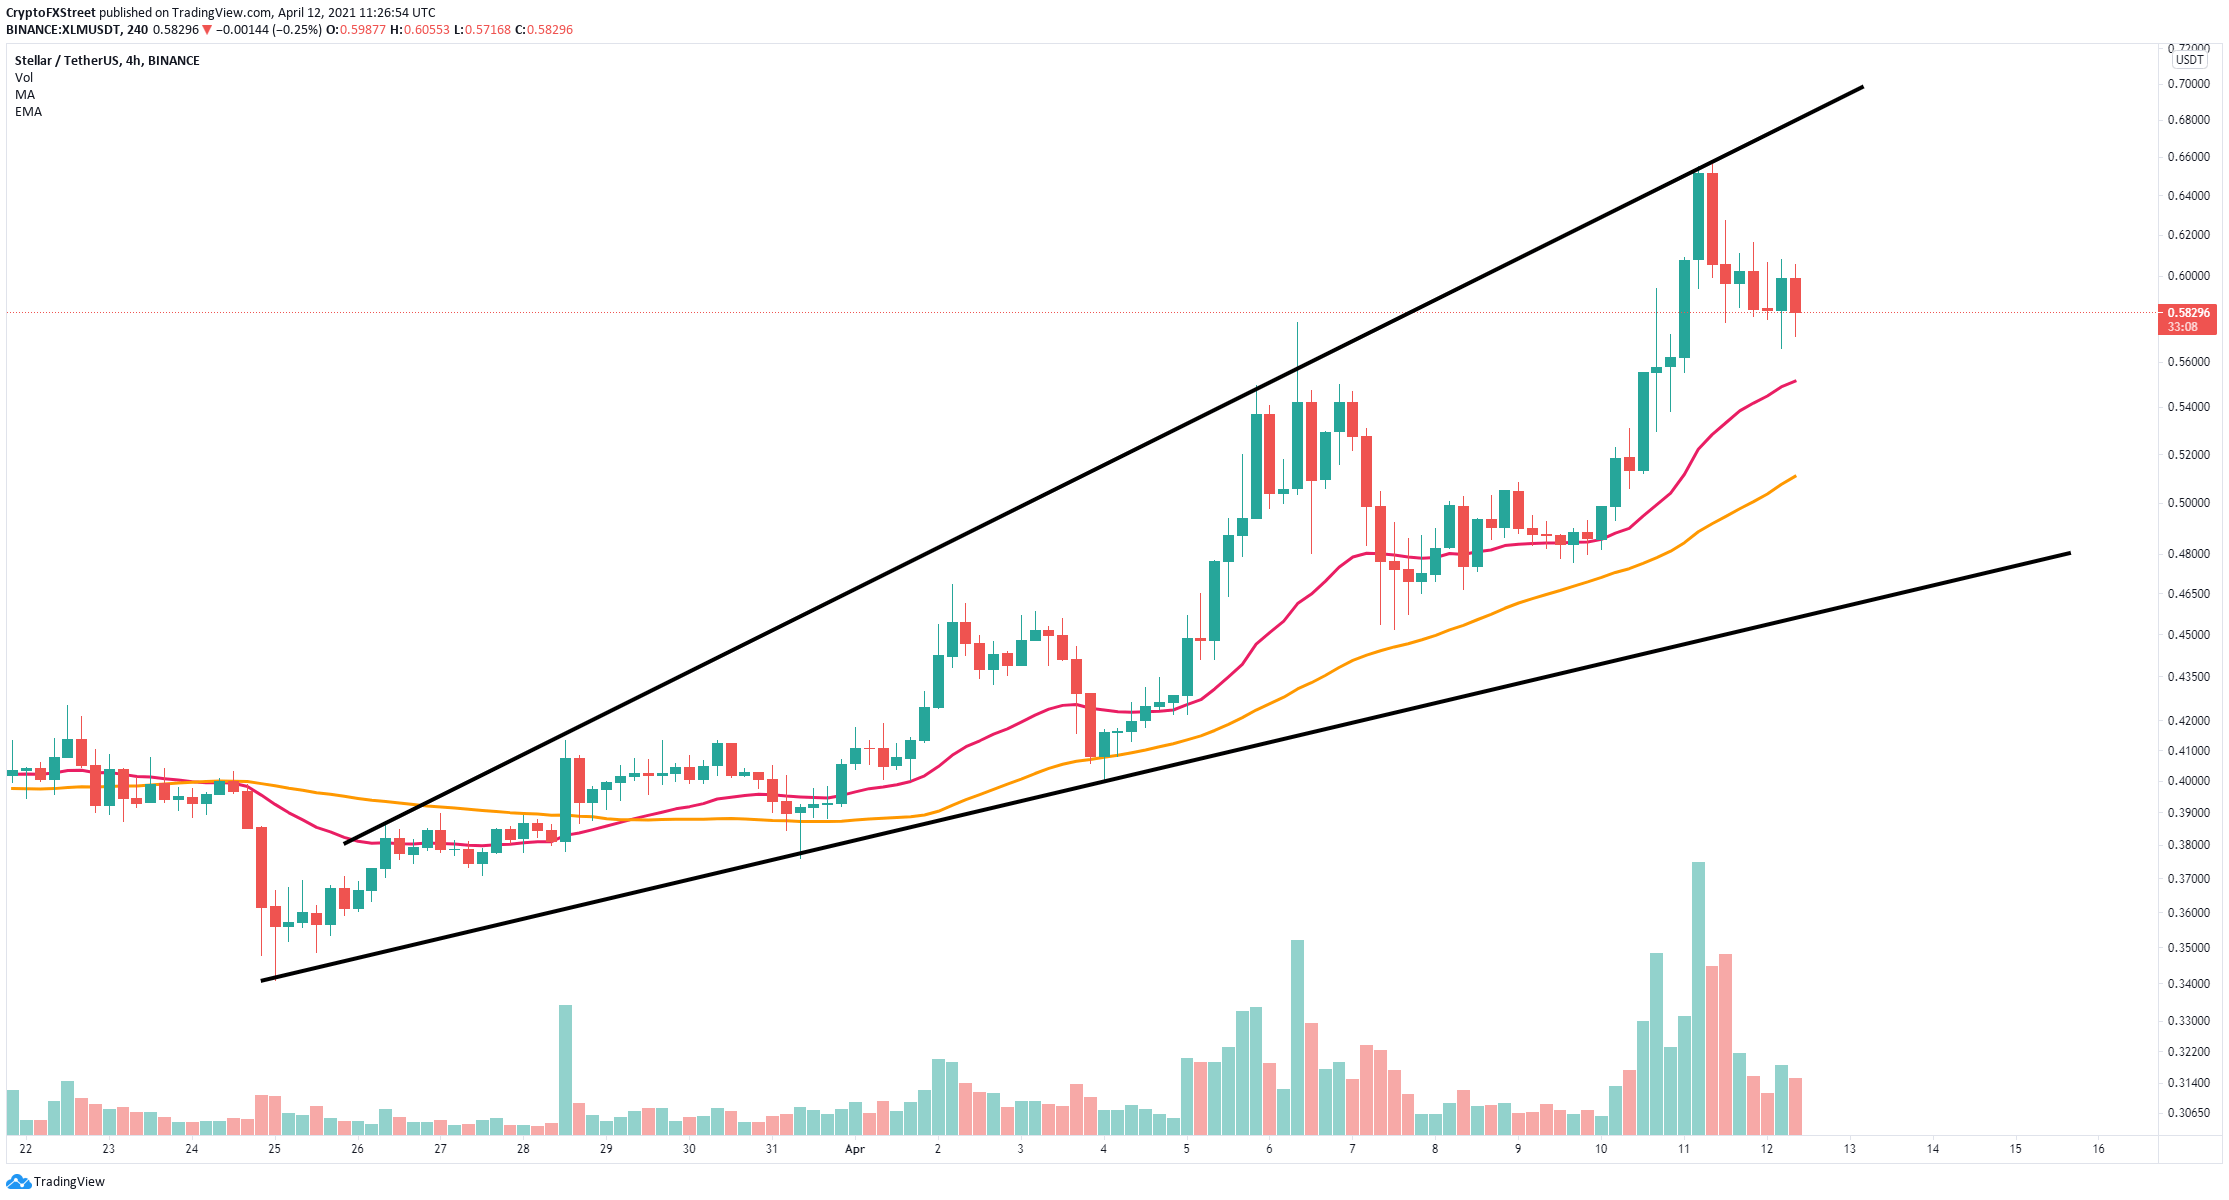
XLM/USD 4-hour chart

Considering the high funding rates, the digital asset could be poised for further downside action. The 26 four-hour EMA support level at $0.55 is the most significant in the short term. A breakdown below this moving average will push XLM price down to $0.51 at the 50 four-hour SMA support and as low as $0.47 at the lower trend line of the pattern. 

However, successfully defending the 26 four-hour EMA could reignite the bullish momentum of XLM and drive the asset toward the upper boundary of the pattern again at $0.685.


Note: All information on this page is subject to change. The use of this website constitutes acceptance of our user agreement. Please read our privacy policy and legal disclaimer. Opinions expressed at FXstreet.com are those of the individual authors and do not necessarily represent the opinion of FXstreet.com or its management. Risk Disclosure: Trading foreign exchange on margin carries a high level of risk, and may not be suitable for all investors. The high degree of leverage can work against you as well as for you. Before deciding to invest in foreign exchange you should carefully consider your investment objectives, level of experience, and risk appetite. The possibility exists that you could sustain a loss of some or all of your initial investment and therefore you should not invest money that you cannot afford to lose. You should be aware of all the risks associated with foreign exchange trading, and seek advice from an independent financial advisor if you have any doubts.

Join Telegram

Recommended content


Recommended Content

Editors’ Picks

Ripple on-chain metrics show bullish signs amidst legal struggle with SEC, XRP eyes recovery

Ripple on-chain metrics show bullish signs amidst legal struggle with SEC, XRP eyes recovery

Ripple made a comeback above $0.48 on Tuesday and hovers above that level in Wednesday’s European session. Ripple on-chain metrics such as transaction volume and Network Realized Profit/Loss have turned bullish, supporting a recovery in the altcoin. 

More Ripple News

Bitcoin price falls amidst German government transfers, miners activity

Bitcoin price falls amidst German government transfers, miners activity

Bitcoin (BTC) extends correction on Wednesday and hovers around $61,000 after finding resistance near the $64,000 level on Monday. Recent on-chain data indicates heightened selling activity from Bitcoin miners early in the week. 

More Bitcoin News

Crypto Today: Bitcoin erases gains from end of June, Ethereum declines while Ripple holds

Crypto Today: Bitcoin erases gains from end of June, Ethereum declines while Ripple holds

Bitcoin wipes out gains from the last week of June and falls below $60,000 on Wednesday. Ethereum and top altcoins ranked by market capitalization erased gains as the inflation outlook worsened. Ripple holds on to recent gains and hovers above $0.48 on Wednesday. 

More Cryptocurrencies News

Three reasons why altcoins could shake off losses this week

Three reasons why altcoins could shake off losses this week

On-chain data from Santiment shows that altcoins are currently in the opportunity zone, or generating buy signals. The top three altcoins in the buy zone are Basic Attention Token (BAT), Chromia (CHR), and Highstreet (HIGH), per Santiment. 

More Altcoins News

Bitcoin: BTC price correction could end in July, according to seasonal data

Bitcoin: BTC price correction could end in July, according to seasonal data

Bitcoin (BTC) price appears poised for a decline this week, influenced by slight outflows in US spot ETFs, selling activity among BTC miners, and a combined transfer of 4,690.28 BTC to centralized exchanges by the US and German governments.

Read full analysis

BTC

ETH

XRP