- Stellar has printed a double-bottom pattern, leading to gains above $0.36.
- The MACD is likely to flip bullish in the short-term as XLM momentum becomes stronger.
- The 4-hour SuperTrend indicator recently sent a signal to short Stellar, casting a bearish cloud.
Stellar plunged to levels around $0.34 before the ongoing recovery came into play. The entire cryptocurrency market has been on a downtrend this week. However, minor gains can be witnessed across the board on Friday, with cryptoassets such as XLM rebounding from crucial support levels.
Stellar makes a comeback from weekly lows
The cross-border token has been on an upward roll following the formation of a double-bottom pattern. This is a highly bullish technical pattern that forms after an asset hits a particular anchor zone a couple of times, separated by a peak.
The double-bottom pattern is confirmed in technical analysis when the asset bounces off the support area. Its recovery is characterized by increased trading volume. It is crucial to wait for the confirmation of this pattern to avoid false breakouts.
Stellar is likely to continue with the uptrend as long as the support at the double-bottom holds. Note that gains above the 50 Simple Moving Average (SMA) on the 12-hour chart could trigger massive buy orders as XLM heads back to $0.6.
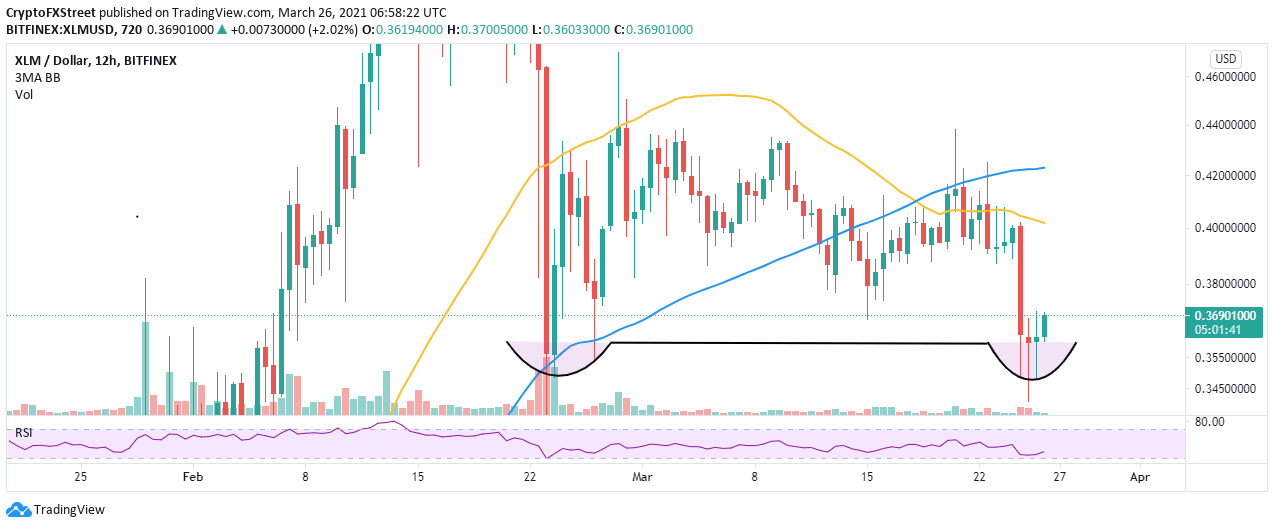
XLM/USD 12-hour chart
The Moving Average Convergence Divergence (MACD) indicator hints that recovery could stay intact in the near term. However, the uptrend will be validated by the MACD line (blue) crossing above the signal line on the 4-hour chart.
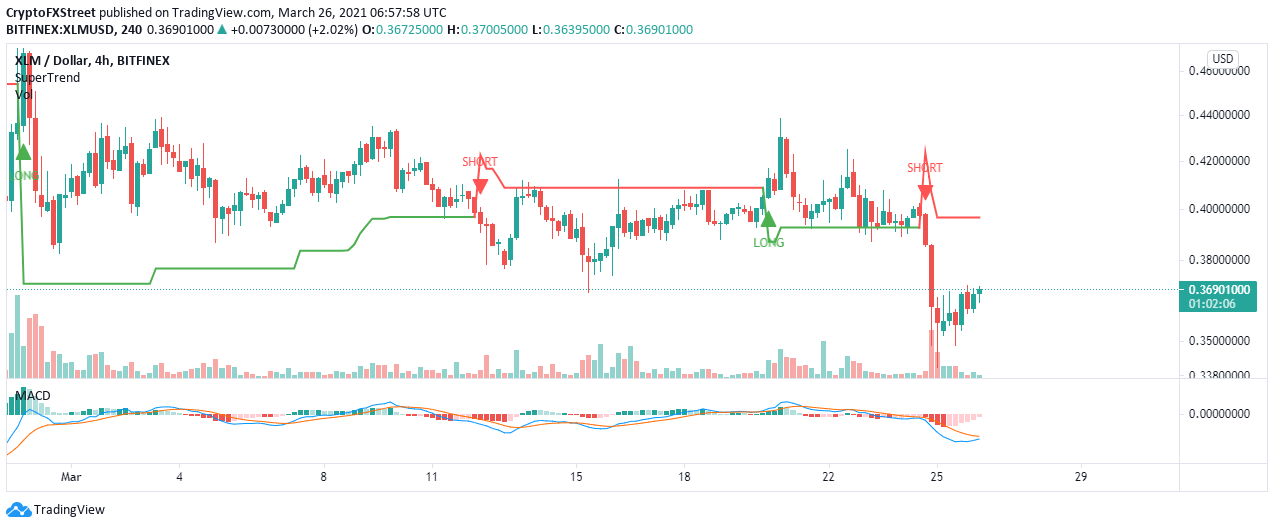
XLM/USD 4-hour chart
Looking at the other side of the picture
The SuperTrend indicator has recently flashed a sell signal on the 4-hour chart. This call to sell occurred when the indicator flipped above the price and turned red. Traders use the SuperTrend indicator to foresee the general direction of the asset. If the situation remains the same, Stellar may start retreating to the support at $0.34 and $0.3, respectively.
Information on these pages contains forward-looking statements that involve risks and uncertainties. Markets and instruments profiled on this page are for informational purposes only and should not in any way come across as a recommendation to buy or sell in these assets. You should do your own thorough research before making any investment decisions. FXStreet does not in any way guarantee that this information is free from mistakes, errors, or material misstatements. It also does not guarantee that this information is of a timely nature. Investing in Open Markets involves a great deal of risk, including the loss of all or a portion of your investment, as well as emotional distress. All risks, losses and costs associated with investing, including total loss of principal, are your responsibility. The views and opinions expressed in this article are those of the authors and do not necessarily reflect the official policy or position of FXStreet nor its advertisers. The author will not be held responsible for information that is found at the end of links posted on this page.
If not otherwise explicitly mentioned in the body of the article, at the time of writing, the author has no position in any stock mentioned in this article and no business relationship with any company mentioned. The author has not received compensation for writing this article, other than from FXStreet.
FXStreet and the author do not provide personalized recommendations. The author makes no representations as to the accuracy, completeness, or suitability of this information. FXStreet and the author will not be liable for any errors, omissions or any losses, injuries or damages arising from this information and its display or use. Errors and omissions excepted.
The author and FXStreet are not registered investment advisors and nothing in this article is intended to be investment advice.
Recommended Content
Editors’ Picks
Ripple on-chain metrics show bullish signs amidst legal struggle with SEC, XRP eyes recovery
Ripple made a comeback above $0.48 on Tuesday and hovers above that level in Wednesday’s European session. Ripple on-chain metrics such as transaction volume and Network Realized Profit/Loss have turned bullish, supporting a recovery in the altcoin.
Bitcoin price falls amidst German government transfers, miners activity
Bitcoin (BTC) extends correction on Wednesday and hovers around $61,000 after finding resistance near the $64,000 level on Monday. Recent on-chain data indicates heightened selling activity from Bitcoin miners early in the week.
Crypto Today: Bitcoin erases gains from end of June, Ethereum declines while Ripple holds
Bitcoin wipes out gains from the last week of June and falls below $60,000 on Wednesday. Ethereum and top altcoins ranked by market capitalization erased gains as the inflation outlook worsened. Ripple holds on to recent gains and hovers above $0.48 on Wednesday.
Three reasons why altcoins could shake off losses this week
On-chain data from Santiment shows that altcoins are currently in the opportunity zone, or generating buy signals. The top three altcoins in the buy zone are Basic Attention Token (BAT), Chromia (CHR), and Highstreet (HIGH), per Santiment.
Bitcoin: BTC price correction could end in July, according to seasonal data
Bitcoin (BTC) price appears poised for a decline this week, influenced by slight outflows in US spot ETFs, selling activity among BTC miners, and a combined transfer of 4,690.28 BTC to centralized exchanges by the US and German governments.