XLM Price Prediction: Stellar primed for 55% bull rally
- XLM price is preparing for a massive upswing that could take it to pre-crash levels at $0.643.
- The bullish divergence between Stellar price and OBV and a potential bullish crossover on the MACD add credence to this thesis.
- A breakdown of the support barrier at $0.342 will trigger a bearish outlook.

XLM price began its uptrend as it created a higher low, setting up a bullish divergence between a crucial volume indicator. Now a continuation of this uptrend could take Stellar to the levels seen on May 19.
XLM price hints at a blast-off soon
XLM price created a local bottom on May 23 at $0.338 and another one on May 30 at $0.372. While Stellar set up higher lows, the On-Balance-Volume (OBV) indicator set up a lower low, creating a bullish divergence relative to the price. Therefore, investors can expect XLM price to rally.
Further cementing this bullish outlook is the Moving Average Convergence Divergence (MACD) indicator, whose fast-length moving average (12-day) is vying for a move above the slow-length moving average (26-day). If such a move were to happen, it would represent a bullish crossover.
This development suggests that the short-term bullish momentum is rising faster, adding credence to the bullish thesis explained above.
Therefore, XLM price seems ready to rise 55% to tag $0.643 after slicing through critical resistance levels at $0.497 and $0.566, respectively.
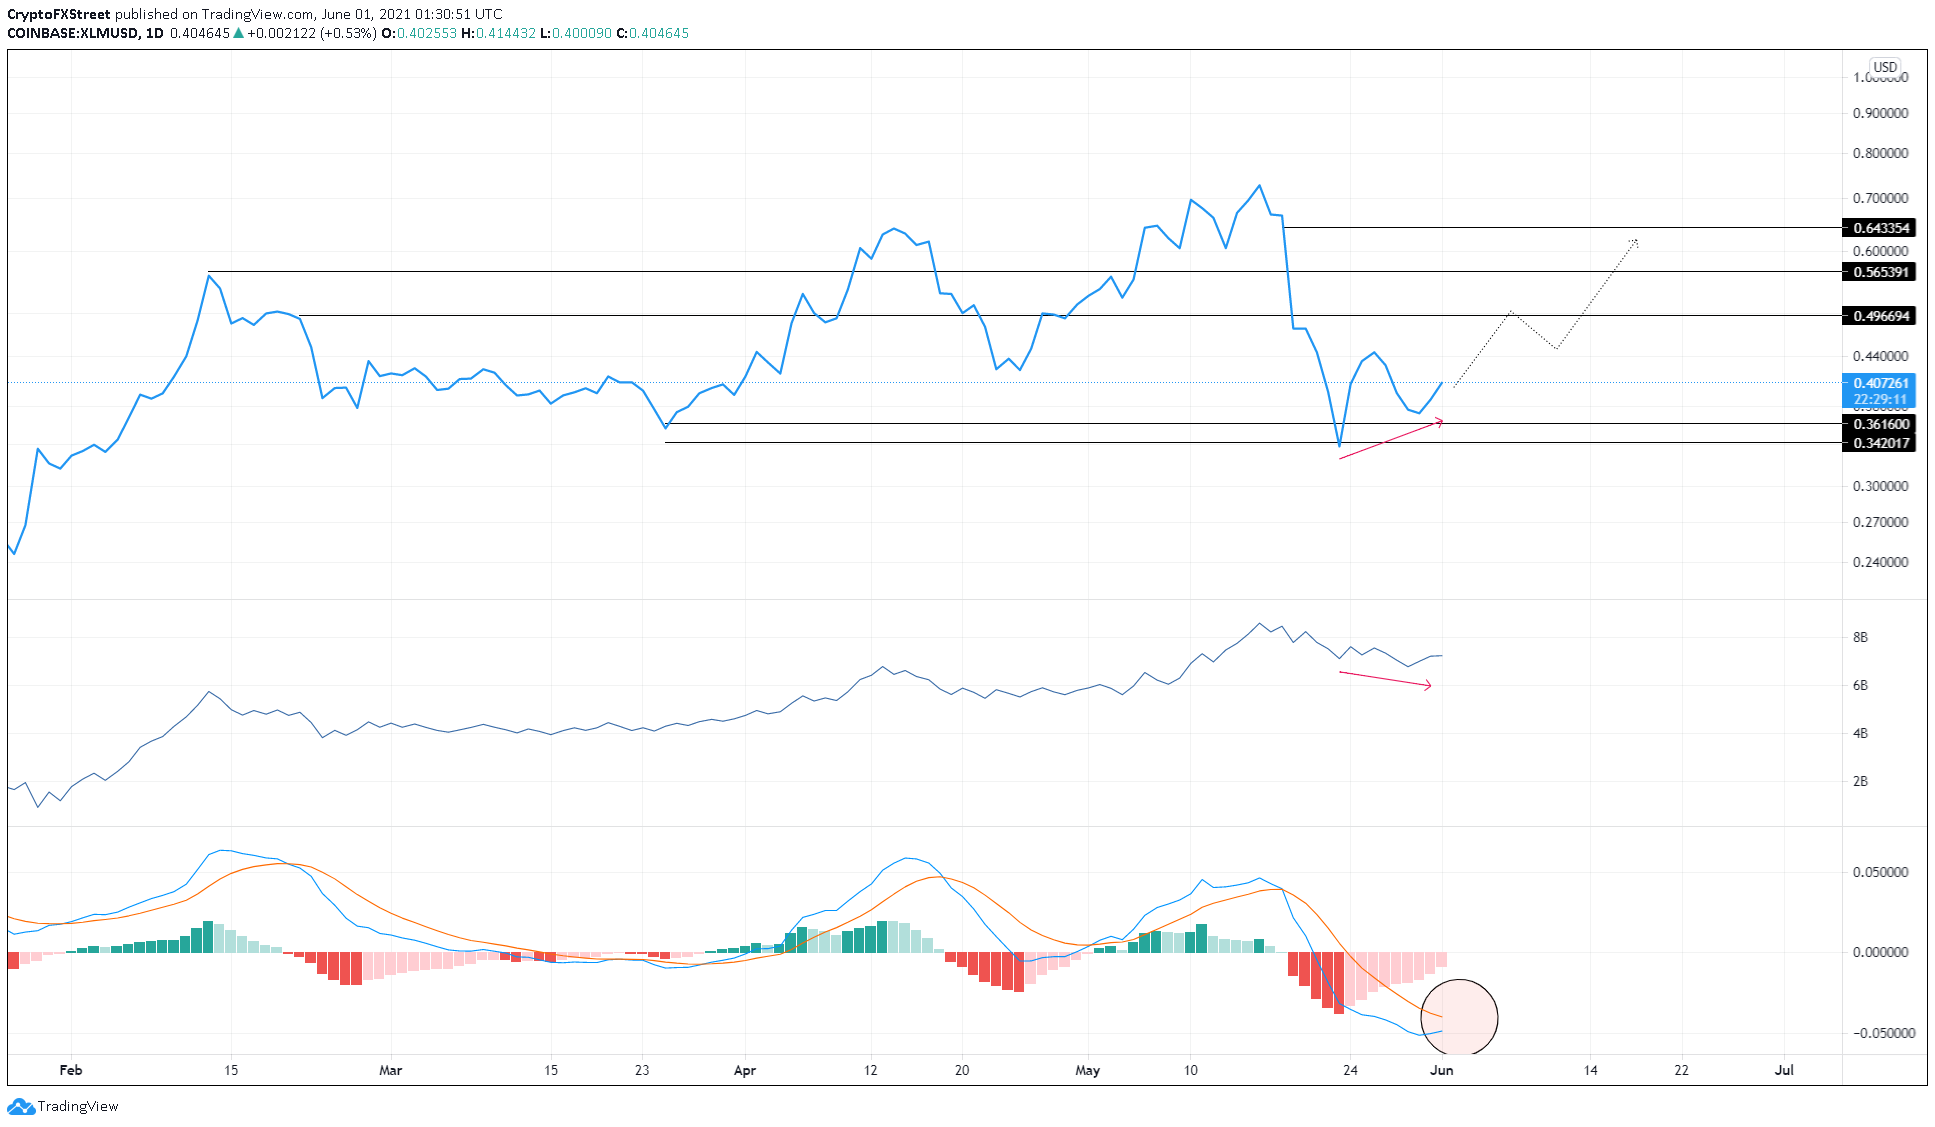
XLM/USDT 1-day chart
If XLM price sets up a lower low below $0.362, it will signify a weakening buying pressure. However, a breakdown of the support level at $0.342 will invalidate the bullish thesis detailed above.
In that case, investors can expect Stellar price to move sideways or sweep the lows here.
Author

Akash Girimath
FXStreet
Akash Girimath is a Mechanical Engineer interested in the chaos of the financial markets. Trying to make sense of this convoluted yet fascinating space, he switched his engineering job to become a crypto reporter and analyst.