XLM Price Prediction: Stellar poised for a 15% decline as slow-motion squeeze not convincing
- XLM price bearish pattern remains operative, despite bounce.
- Stellar reclaims 10-week simple moving average (SMA), but not enough.
- Hopes that the European Union will issue its CBDC on Stellar still linger.

XLM price activated the head-and-shoulders top pattern on April 22 when it fell below the neckline. The bearish pattern remains operative until Stellar rallies above the high of the right shoulder.
XLM price decline does achieve a similar oversold reading as other lows
The previous three major corrections have averaged around 50%, and two of the three were short, lasting four and nine days, respectively. At the April 22 low of $0.390, Stellar was down over 43%, but far from the head-and-shoulders measured move target of $0.304.
The sell-off and ensuing consolidation permitted Stellar to reach a similar oversold reading on the daily Relative Strength Index (RSI) as the December 2020 low and well below the readings at the January low and February low.
The RSI reading does stack one indicator in favor of a continued rally. Still, the muted price strength on up days and the below-average volume do infer a lack of conviction, particularly compared to what transpired with other cryptocurrencies.
A firm low has likely been printed, but the outlook projects some mild weakness that could knock Stellar down to the minor trendline from April 22 through April 25, representing a decline of slightly over 15% from the current price. Some support intervenes at the combination of the neckline with the 100 twelve-hour SMA at $0.460.
If the minor trend line breaks, then speculators should trade against the rising trendline from the February low through the March low at $0.378.
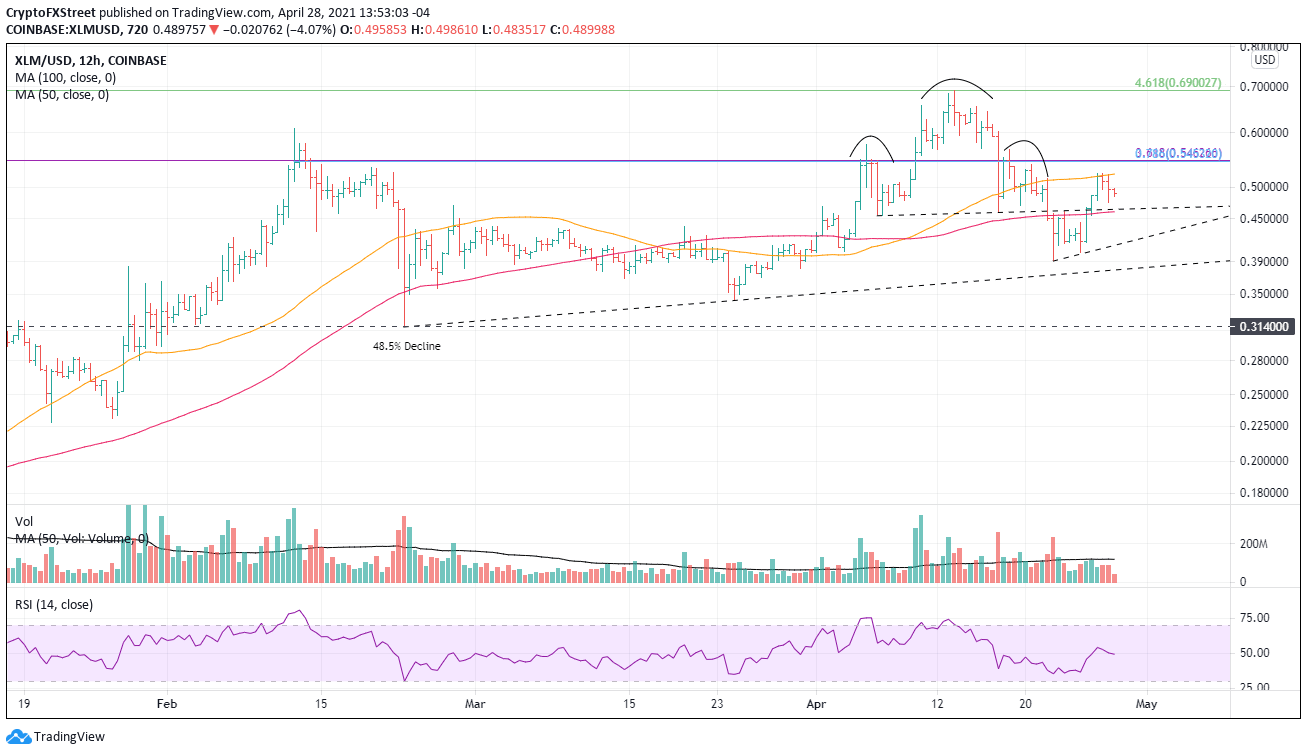
XLM/USD 12-hour chart
Cryptocurrencies are known to surprise, stressing the need to define the resistance levels for Stellar. Already in play, the 50 twelve-hour SMA at $0.522 is significant, closing followed by the meeting of Fibonacci levels at $0.545. Do not forget the high of the right shoulder at $0.566.
A determined move could return XLM price to the all-time high at $0.690, which corresponds to the 461.8% extension of the 2019-2020 bear market.
Author

Sheldon McIntyre, CMT
Independent Analyst
Sheldon has 24 years of investment experience holding various positions in companies based in the United States and Chile. His core competencies include BRIC and G-10 equity markets, swing and position trading and technical analysis.


