XLM Price Prediction: Stellar hesitation signals weakness, projects new low
- XLM price is forming a ledge pattern under the 100 twelve-hour moving average and neckline.
- Bullish hammer pattern triggered yesterday, but commitment proved fleeting.
- No bullish momentum divergences to galvanize hopes for a sustained rebound.

XLM price busted the neckline of a head-and-shoulders top pattern on April 22 and quickly plunged below the 100-day simple moving average (SMA) before attracting bids and propelling higher. The bearish thesis first outlined in an April 20 FXStreet article remains viable given the price hesitation following the bullish hammer pattern triggered on April 23.
XLM price boredom today masks internal warfare
The last three major corrections have averaged around 50%, and two of the three were short, lasting four and nine days, respectively. Based on the Stellar head-and-shoulders pattern measured move target of $0.304, it forecasts a loss of just over 50% from the April 13 high.
A decline of that magnitude would drive the daily Relative Strength Index (RSI) into oversold territory (below 30), proclaiming a momentum low for the correction and the basis for a new, long-term rally. Without it, Stellar will be challenged to complete recovery to new highs.
It is important to briefly mention that momentum lows do not always coincide with price lows. In fact, price lows are often established days or even weeks after the momentum low.
The path to the measured move target of $0.304 includes the April 23 hammer low at $0.390, the rising trendline from the February 22 low at $0.372, and the February low at $0.314.
To review, at the measured move target, Stellar will be down 30% from the current price at $0.431, 34% from the neckline of the head-and-shoulders top pattern, and 55% from the April 13 high at $0.690. Perhaps, most importantly, if the February low is breached, it will break the series of higher lows for XLM price corrections and thrust the digital coin’s bullish speculators into a long waiting game.
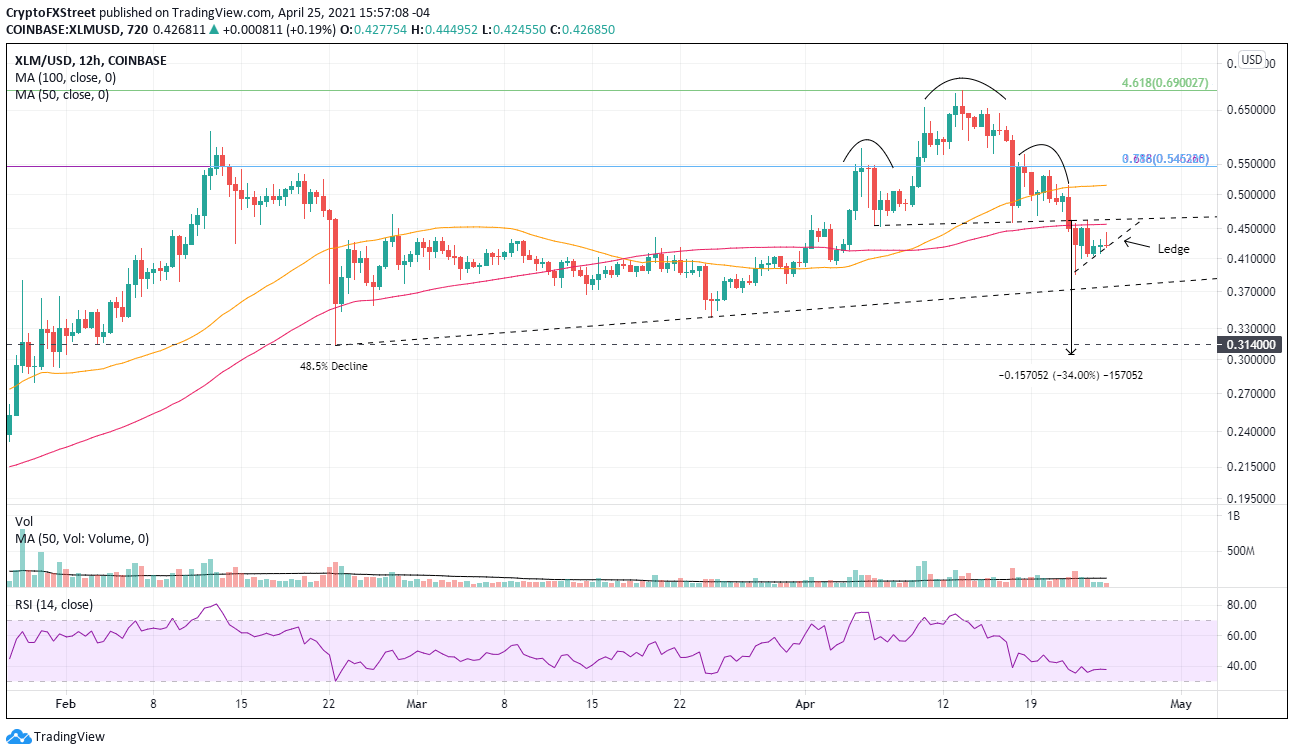
XLM/USD 12-hour chart
Cryptocurrencies are known to surprise, stressing the need to define resistance levels for Stellar. Already in play, the 100 twelve-hour SMA at $0.456 is significant, closely followed by the neckline at $0.463. If the token closes above the neckline, it raises the odds of a test of the 50 twelve-hour SMA at $0.514. The meeting of Fibonacci levels at $0.545 stands in the way of a test of the all-time high at $0.690, which also corresponds to the 461.8% Fibonacci extension of the 2019-2020 bear market.
Author

Sheldon McIntyre, CMT
Independent Analyst
Sheldon has 24 years of investment experience holding various positions in companies based in the United States and Chile. His core competencies include BRIC and G-10 equity markets, swing and position trading and technical analysis.


