- XLM price is on the verge of a breakout as it approaches a critical supply barrier.
- Stellar is traversing a symmetrical triangle pattern, hinting at a quick 20% upswing.
- A long-term outlook reveals XLM could surge 120% to hit $1 under exceptional circumstances.
The XLM price is meandering inside a technical pattern vying to slice through the barrier present ahead.
XLM price gears up for higher high
The XLM price reveals a symmetrical triangle pattern when the multiple lower highs and higher lows since January 27 are connected using trend lines. This technical formation forecasts a 62% move after successful confirmation of a breakout.
For now, Stellar looks primed after a bounce from the 50-day Simple Moving Average (SMA). If the bullish momentum persists, the XLM price could produce a decisive close above the immediate supply barrier at $0.50, coinciding with the 78.6% Fibonacci retracement level.
Following this, the remittances token could pierce the technical formation’s upper trend line at $0.54. This move would signal the start of a bullish wave. If a spike in buying pressure ensues, the XLM price could surge 25% toward the first breakout line at $0.67, set up by the Momentum Reversal Indicator (MRI).
Subsequent areas of interest include the 127.2% and the 141.4% Fibonacci extension levels at $0.74 and $0.81, respectively. Clearing these levels might open up the path to the intended target at $0.87.
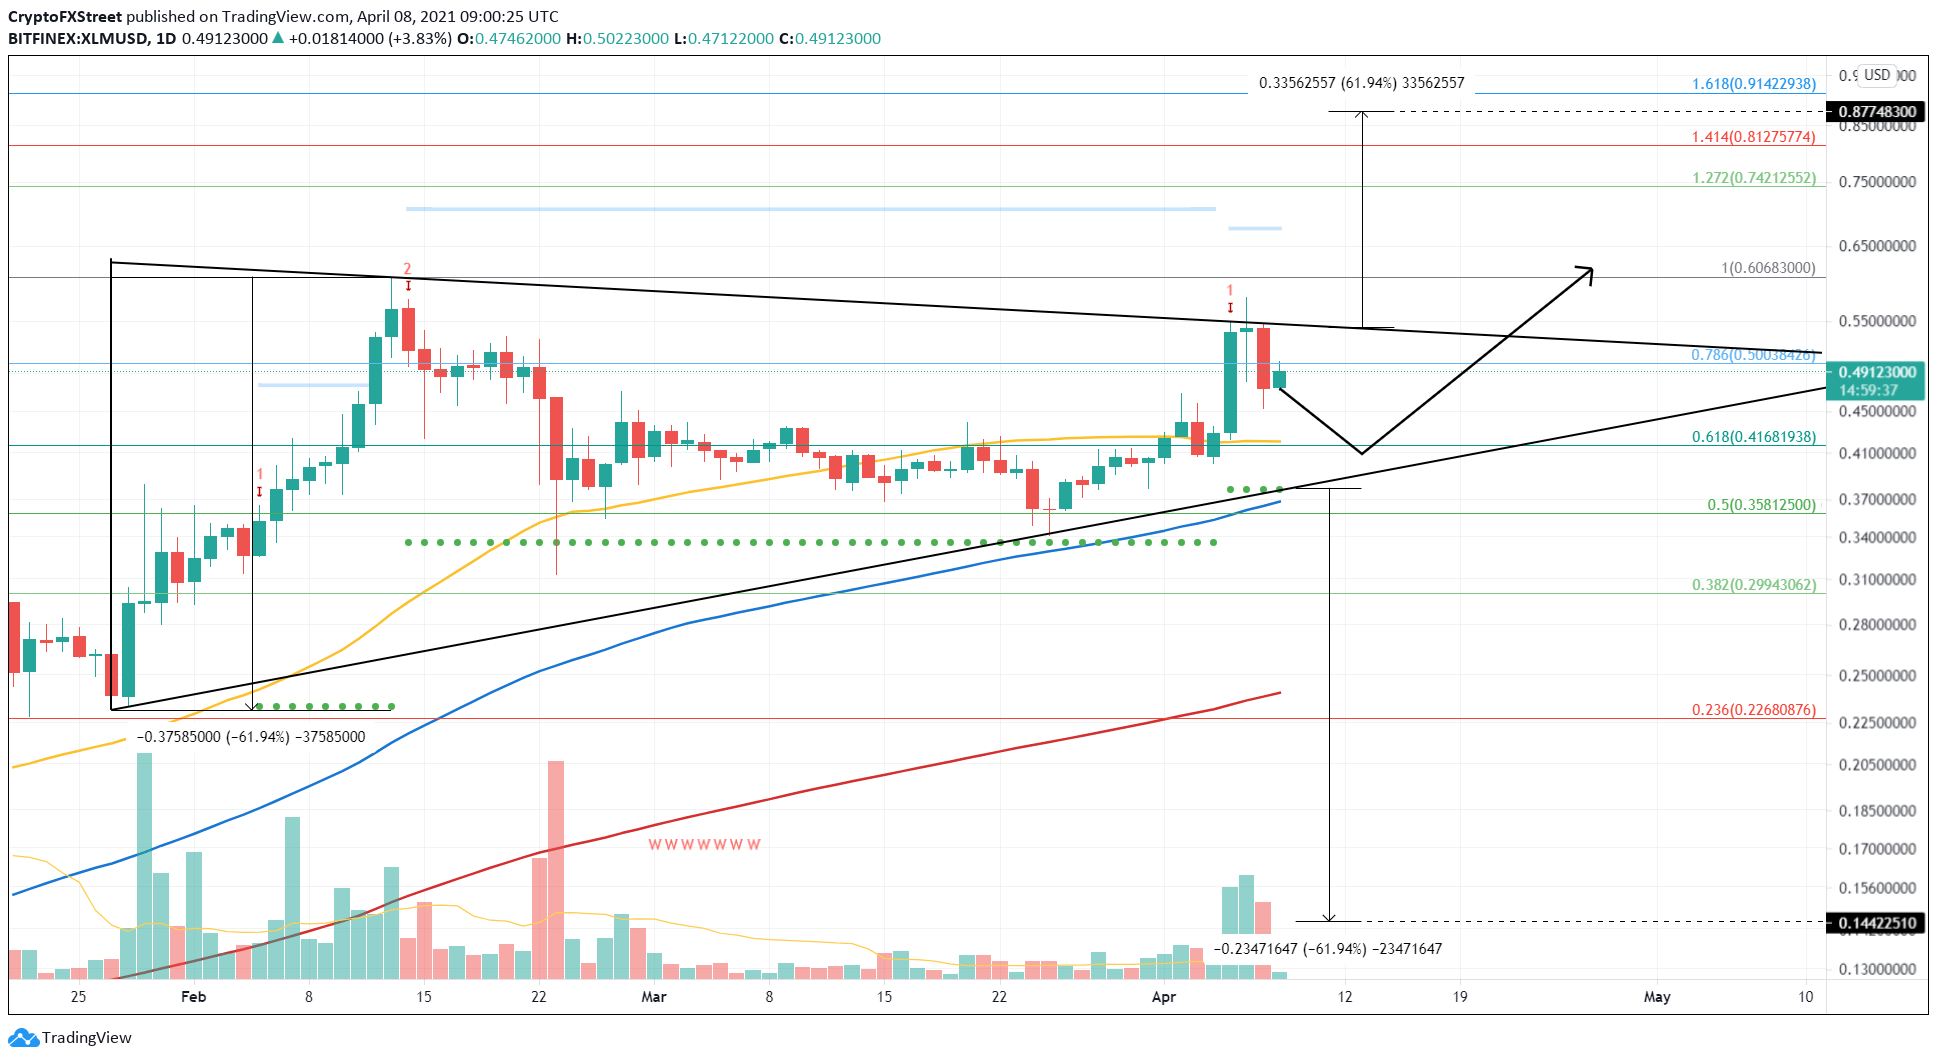
XLM/USD 1-day chart
A different perspective on the bullish outlook for Stellar can be seen in the chart below. From late November 2020 to date, the XLM price has installed three higher highs and two lower lows.
An ascending parallel channel is revealed when the swing points are connected using trend lines. Interestingly, each bounce from the lower trend line that sets up the next swing high sees a 200% uptrend. The retracement that follows after reaching the upper trend line averages around 45%.
Since the XLM price has already retraced 45% from the recent highs at $0.60, the logical thing to expect here would be a massive blast off. If something similar were to happen, the remittances token could surge 120% to hit the $1 mark.
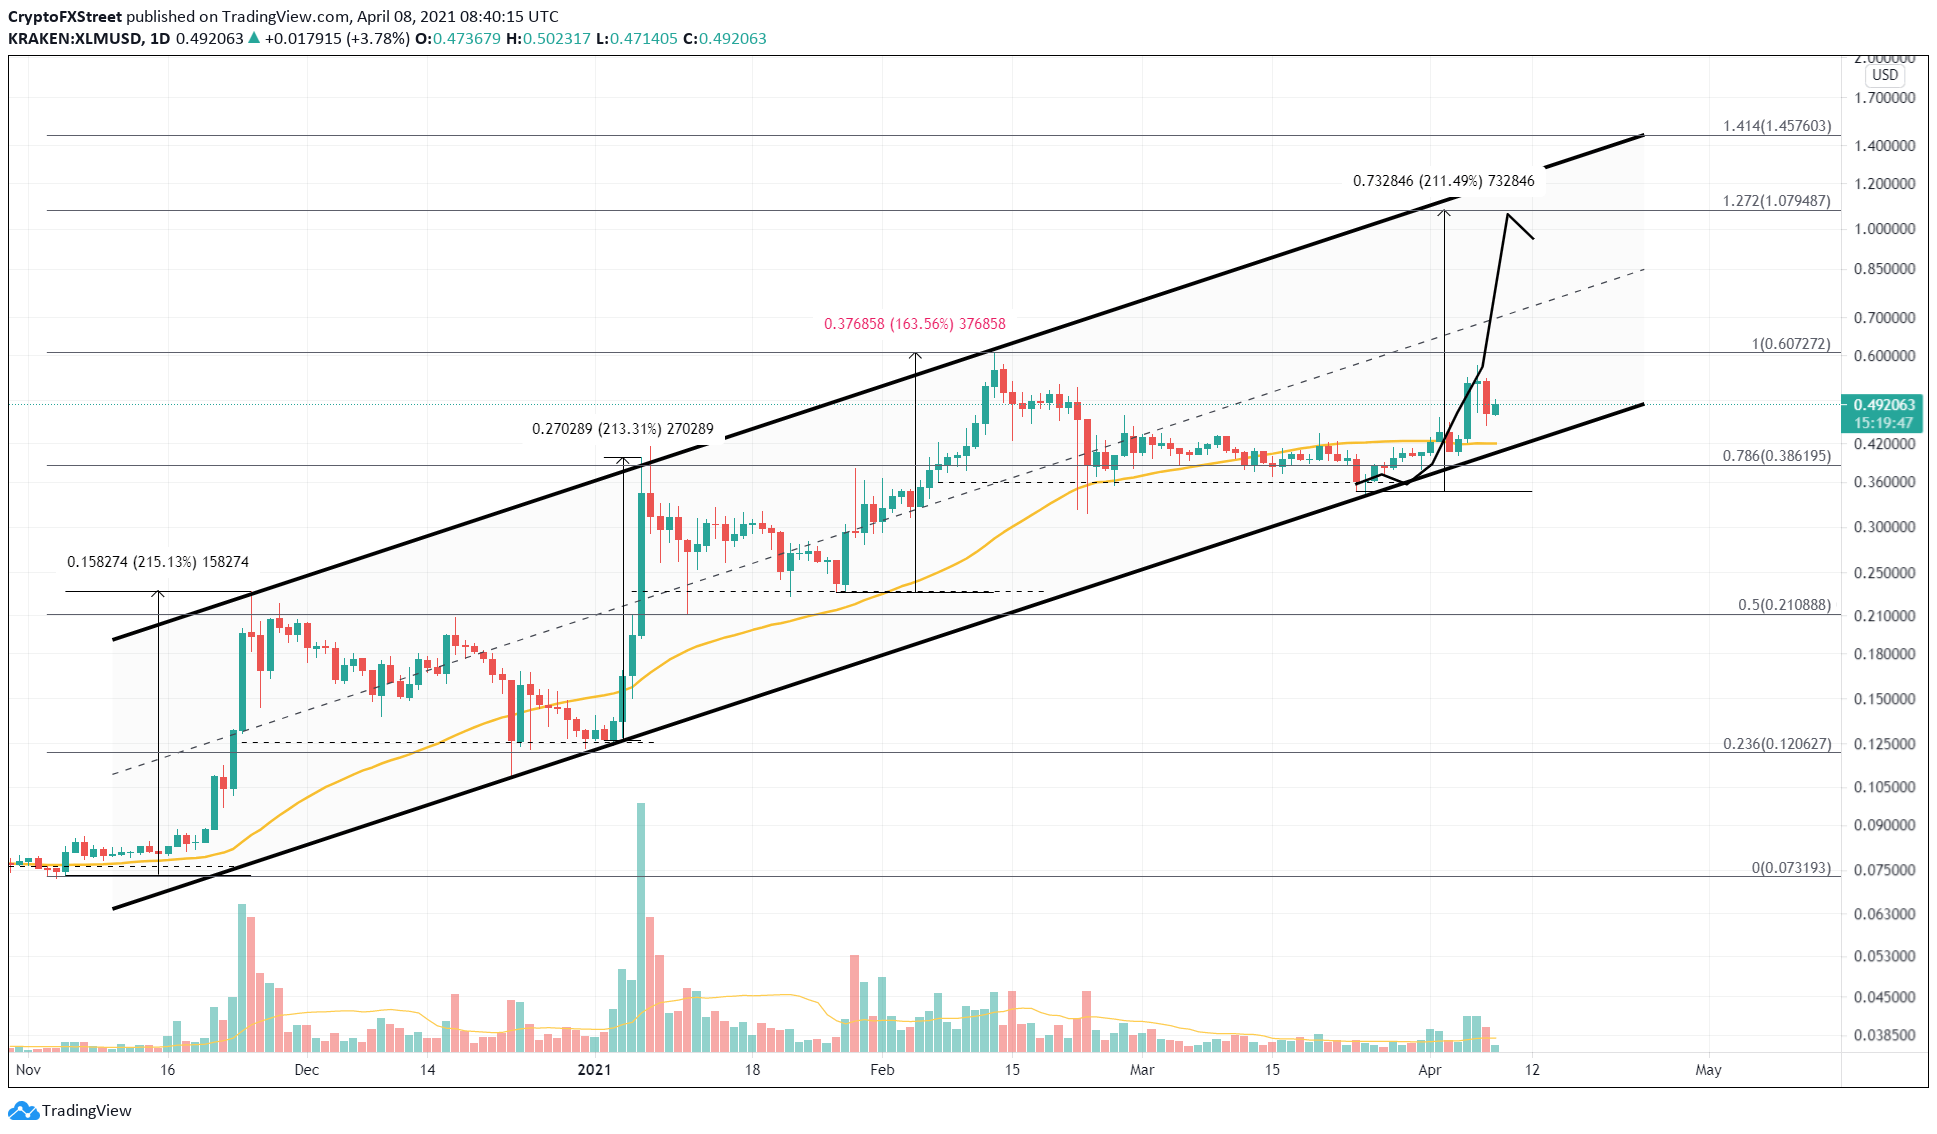
XLM/USD 1-day chart
Stellar’s bearish scenario could evolve if the symmetrical triangle’s lower trend line at $0.37 is breached. In this case, the XLM price could decline 11% toward the MRI State Trend Support at $0.33.
If the sellers push the cryptocurrency beyond $0.33 for an extended period, it would solidify the bearish outlook and open up the altcoin for more downside.
Information on these pages contains forward-looking statements that involve risks and uncertainties. Markets and instruments profiled on this page are for informational purposes only and should not in any way come across as a recommendation to buy or sell in these assets. You should do your own thorough research before making any investment decisions. FXStreet does not in any way guarantee that this information is free from mistakes, errors, or material misstatements. It also does not guarantee that this information is of a timely nature. Investing in Open Markets involves a great deal of risk, including the loss of all or a portion of your investment, as well as emotional distress. All risks, losses and costs associated with investing, including total loss of principal, are your responsibility. The views and opinions expressed in this article are those of the authors and do not necessarily reflect the official policy or position of FXStreet nor its advertisers. The author will not be held responsible for information that is found at the end of links posted on this page.
If not otherwise explicitly mentioned in the body of the article, at the time of writing, the author has no position in any stock mentioned in this article and no business relationship with any company mentioned. The author has not received compensation for writing this article, other than from FXStreet.
FXStreet and the author do not provide personalized recommendations. The author makes no representations as to the accuracy, completeness, or suitability of this information. FXStreet and the author will not be liable for any errors, omissions or any losses, injuries or damages arising from this information and its display or use. Errors and omissions excepted.
The author and FXStreet are not registered investment advisors and nothing in this article is intended to be investment advice.
Recommended Content
Editors’ Picks

Bitcoin Weekly Forecast: BTC nosedives below $95,000 as spot ETFs record highest daily outflow since launch
Bitcoin price continues to edge down, trading below $95,000 on Friday after declining more than 9% this week. Bitcoin US spot ETFs recorded the highest single-day outflow on Thursday since their launch in January.

Bitcoin crashes to $96,000, altcoins bleed: Top trades for sidelined buyers
Bitcoin (BTC) slipped under the $100,000 milestone and touched the $96,000 level briefly on Friday, a sharp decline that has also hit hard prices of other altcoins and particularly meme coins.

Solana Price Forecast: SOL’s technical outlook and on-chain metrics hint at a double-digit correction
Solana (SOL) price trades in red below $194 on Friday after declining more than 13% this week. The recent downturn has led to $38 million in total liquidations, with over $33 million coming from long positions.

SEC approves Hashdex and Franklin Templeton's combined Bitcoin and Ethereum crypto index ETFs
The SEC approved Hashdex's proposal for a crypto index ETF. The ETF currently features Bitcoin and Ethereum, with possible additions in the future. The agency also approved Franklin Templeton's amendment to its Cboe BZX for a crypto index ETF.

Bitcoin: 2025 outlook brightens on expectations of US pro-crypto policy
Bitcoin (BTC) price has surged more than 140% in 2024, reaching the $100K milestone in early December. The rally was driven by the launch of Bitcoin Spot Exchange Traded Funds (ETFs) in January and the reduced supply following the fourth halving event in April.

Best Forex Brokers with Low Spreads
VERIFIED Low spreads are crucial for reducing trading costs. Explore top Forex brokers offering competitive spreads and high leverage. Compare options for EUR/USD, GBP/USD, USD/JPY, and Gold.