![]() Sheldon McIntyre, CMT
Sheldon McIntyre, CMT
Independent Analyst
- XLM price logging the worst day since June 25, altcoin on track to test the June 22 low of $0.198.
- Stellar daily Relative Strength Index (RSI) is nearing the first oversold reading since June 21.
- A reversion to the 200-week simple moving average (SMA) is the final support before catastrophic outcomes.
XLM price has only recorded three positive weeks over the last nine weeks, with the best weekly gain being 3.19%. After the sustained period of weakness, Stellar now resides just 15% above the 200-week SMA; an indicator last visited in early January. As a result, the downward trajectory remains firm, and the digital asset should test at least the June 22 low of $0.198 moving forward.
XLM price has yet to compel the whales out from the depths
XLM price traded in a descending parallel channel from the June 29 high of $0.293, triggering the second symmetrical triangle in a month. On July 16 and 18, Stellar attempted to release from the channel but was emphatically rejected both times, culminating in today’s -7% decline and renewing the rush to test at least the June 22 low of $0.198.
Standing in front of a test of the June 22 low is the lower range of the descending parallel channel at $0.205, but it should prove to be a minor challenge with the magnet effect of $0.198 pulling on XLM price. A drop to the June 22 low would be just a 7% loss from the current Stellar price.
If selling pressure continues or accelerates in the cryptocurrency complex, XLM price will strike support at the 78.6% Fibonacci retracement of the advance beginning in March 2020 at $0.191. However, under the weight of a heavy market, Stellar could easily test the 200-week sma at $0.182, yielding a 15% fall from the current price and pushing the cryptocurrency into an extreme oversold condition where a sustainable, multi-week rally can potentially commence.
Any weakness below the 200-week SMA will lead to catastrophic outcomes for XLM price.
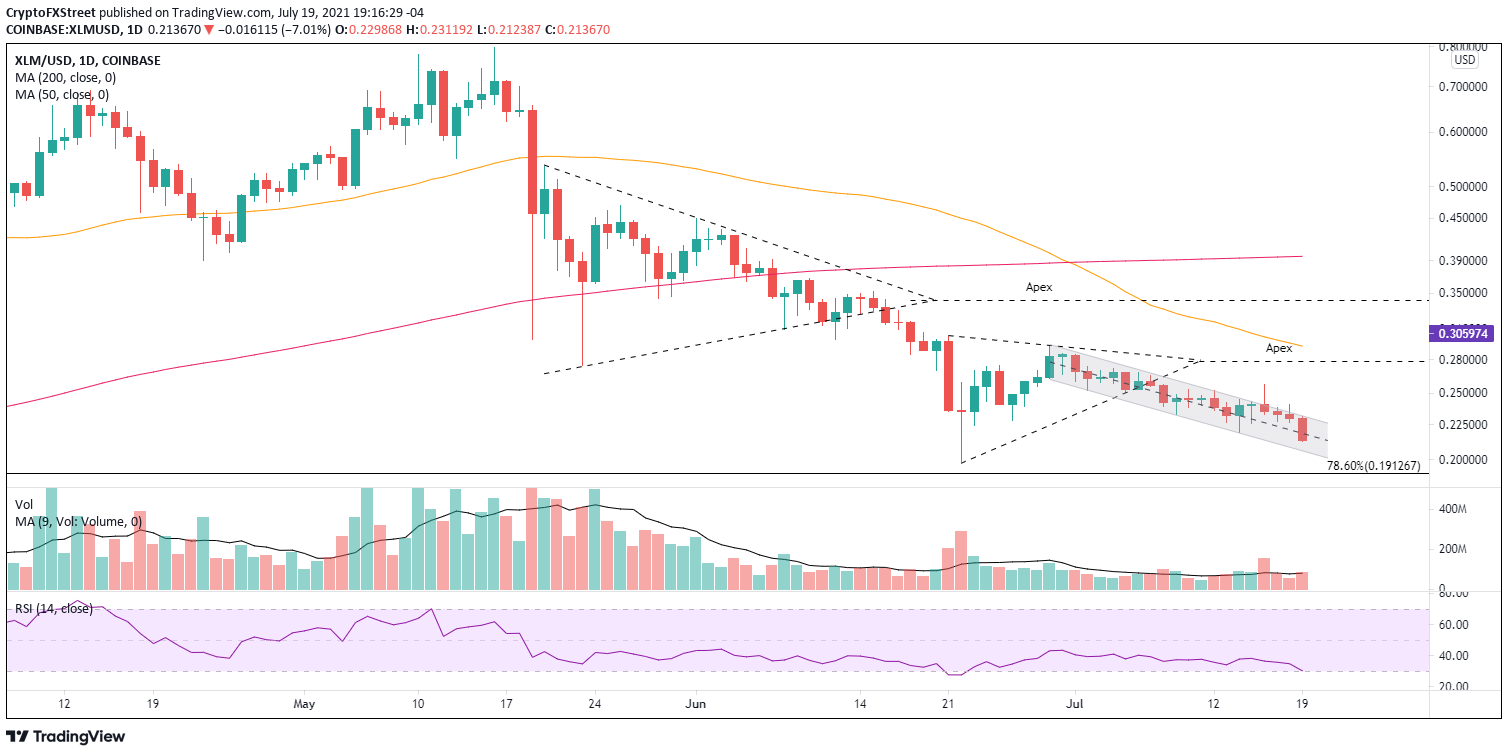
XLM/USD daily chart
An opportunity to the long side becomes more discernible if XLM price records a daily close above the July 18 high of $0.240. Identifiable resistance emerges at the apex of the broken symmetrical triangle in July at $0.278, followed closely by the 50-day SMA at $0.292, representing a 20% gain from the July 18 high.
A robust cryptocurrency market could extend the rally to the apex of the first broken symmetrical triangle in June at $0.341, and if everything aligns for Stellar, a test of the 200-day SMA at $0.386.
XLM price is nearing an inflection point where another -7% decline could mark the end of the significant correction from the May high. Still, the current price structure remains vulnerable to deeper losses as the whales are not surfacing to capitalize on the low prices, putting Stellar in a position of disarray.
Note: All information on this page is subject to change. The use of this website constitutes acceptance of our user agreement. Please read our privacy policy and legal disclaimer. Opinions expressed at FXstreet.com are those of the individual authors and do not necessarily represent the opinion of FXstreet.com or its management. Risk Disclosure: Trading foreign exchange on margin carries a high level of risk, and may not be suitable for all investors. The high degree of leverage can work against you as well as for you. Before deciding to invest in foreign exchange you should carefully consider your investment objectives, level of experience, and risk appetite. The possibility exists that you could sustain a loss of some or all of your initial investment and therefore you should not invest money that you cannot afford to lose. You should be aware of all the risks associated with foreign exchange trading, and seek advice from an independent financial advisor if you have any doubts.
Recommended Content
Editors’ Picks

Tether expands reach with Juventus acquisition and new Bitcoin-native public company launch
Tether announced on Thursday that it had acquired additional shares in Juventus Football Club, bringing its total stake to over 10.12% and representing 6.18% of voting rights. Tether, Bitfinex, SoftBank & Jack Mallers also launch Twenty-One, the first Bitcoin-native public company.

Ethereum Price Forecast: Accumulation addresses grab 1.11 million ETH as bullish momentum rises
Ethereum (ETH) saw a 1% decline on Friday as sellers dominated exchange activity in the past 24 hours. Despite the recent selling, increased inflows into accumulation addresses and declining net taker volume show a gradual return of bullish momentum.

Stacks price eyes $1 amid growing interest in Bitcoin layer-2 protocols' DeFi ecosystems
Stacks (STX) price rises, hitting a new weekly high at $0.90 during the Asian session on Friday. The Bitcoin layer-2 protocol shows bullish resilience, trading at $0.88 at the time of writing, reflecting growing institutional interest in the decentralized finance (DeFi) ecosystem.

Bitcoin's surge to $94,000 shows a mix of macro optimism and shifting investor sentiment: Glassnode
Bitcoin (BTC) traded above $93,000 on Thursday as rumors of US-China tariff easing stirred a rebound in price, sending the percentage of supply in profit at current price levels to 87.3%, 5% above 82.7% recorded in March, according to Glassnode data.
Bitcoin Weekly Forecast: BTC holds steady, Fed warns of tariffs’ impact, as Gold hits new highs
Bitcoin price consolidates above $84,000 on Friday, a short-term support that has gained significance this week. The world's largest cryptocurrency by market capitalization continued to weather storms caused by US President Donald Trump's incessant trade war with China after pausing reciprocal tariffs for 90 days on April 9 for other countries.

The Best brokers to trade EUR/USD
SPONSORED Discover the top brokers for trading EUR/USD in 2025. Our list features brokers with competitive spreads, fast execution, and powerful platforms. Whether you're a beginner or an expert, find the right partner to navigate the dynamic Forex market.