XLM Price Forecast: Stellar has nowhere to go, but down
- XLM price breakout from a symmetrical triangle continuation pattern projects further losses for the digital asset.
- Potential for the 50-week simple moving average (SMA) magnet effect to arrest the developing decline.
- Initial drop nearly registered an oversold condition on the six-hour Relative Strength Index (RSI), suggesting some bounce.

XLM price has broken the lower trend line of a symmetrical triangle pattern, making it the second triangle that has resolved to the downside over the last 21 trading days. Based on the current price structure, Stellar is positioned for further losses, potentially beyond the June 22 low.
XLM price begins the process of cleaning stops and fearful pockets
Since the June 22 low of $0.198, XLM price had been coiling in a symmetrical triangle pattern, liberating the oversold condition following the 40% drop from a previous triangle. However, it did not establish any milestones during the bounce that proposed a long-term bullish outcome for Stellar.
Fundamental to the symmetrical triangle pattern development was the role of the May 23 low of $0.274 and, more importantly, the critical 50-week SMA, currently at $0.269. Each provided some point of resistance for every intra-day pop higher during the triangle formation.
With yesterday’s breakdown from the triangle, Stellar investors should acknowledge that XRP price is vulnerable to a 34% correction from the breakout point at $0.256. The 34% measured move of the triangle forecasts a final low of $0.169. It would negate most of the 2021 gains and bust the support at the June low of $0.198 and the 78.6% Fibonacci retracement level of the March 2020-May 2021 advance at $0.191. Overall, it means a loss of 31% from the current XLM price of $0.246.
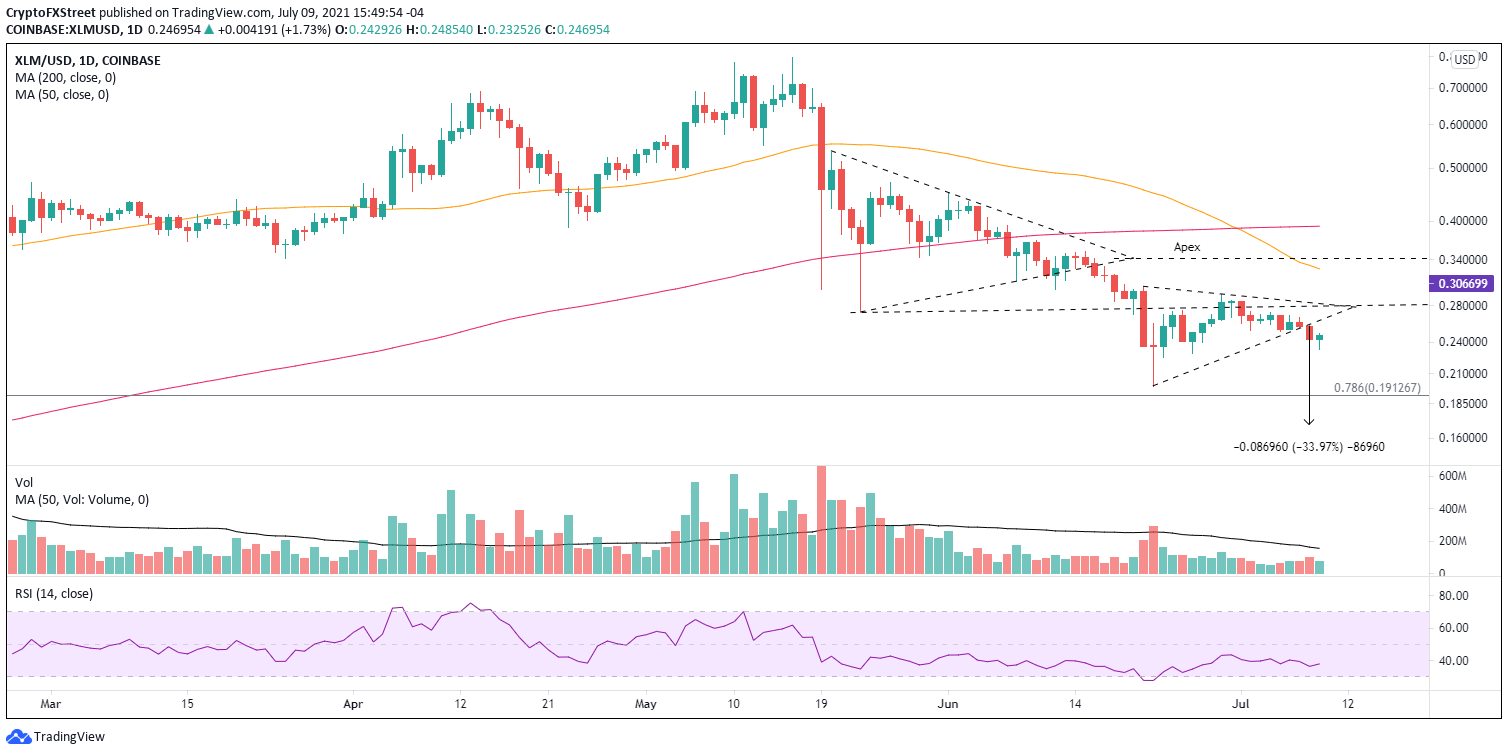
XLM/USD daily chart
It is important to note that the 200-week SMA (mean) is at $0.180, so the measured move would signify a complete reversion to the mean and a confirmed reset for XLM price. Moreover, the total decline from the May high of $0.797 would be 79%.
The weekly chart below highlights the influence of the 200-week SMA on XLM price since the beginning of 2019.
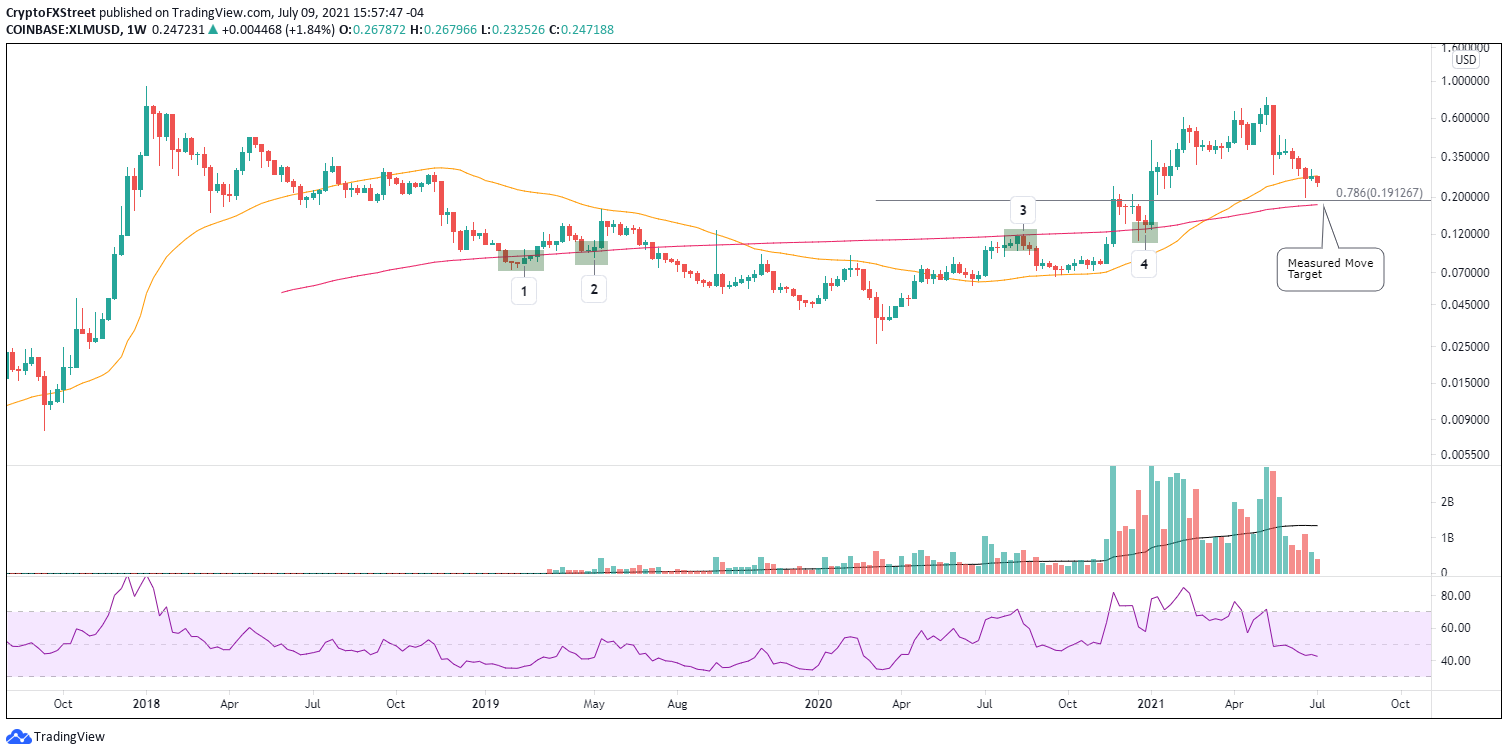
XLM/USD weekly chart
The only way XLM price can void the bearish narrative is with a daily close above the merger of the May 23 low of $0.274 with the symmetrical triangle’s upper trend line at $0.282. But, a rise above $0.282 will not mean a buying stampede will reign over Stellar as the 50-day SMA at $0.326 or the apex of the preceding symmetrical triangle at $0.343 will provide sustainable resistance.
All technical points point to a continuation of the Stellar downward move, knocking out the stops and the fearful holders that populate lower levels. Moreover, XLM price should at least test the June 22 low, but the originating symmetrical triangle pattern projects a deeper descent, possibly to the 200-week SMA. It is an outcome that seemed impossible only a couple of months ago for the blockchain project.
Author

Sheldon McIntyre, CMT
Independent Analyst
Sheldon has 24 years of investment experience holding various positions in companies based in the United States and Chile. His core competencies include BRIC and G-10 equity markets, swing and position trading and technical analysis.


