XLM Price Forecast: Stellar eyes 200% surge if it doesn’t break character
- XLM price is testing a 3-day demand zone ranging from $0.453 to $0.546.
- A successful bounce from it could set the stage for massive gains.
- If the $0.422 support level breaks, Stellar might slide 5% to $0.401.

XLM price has seen dispersing bullish momentum that has led to failed rallies. However, on a higher chart, accumulation could be taking place behind the scenes, potentially leading to an exponential run-up.
XLM price at make-or-break point
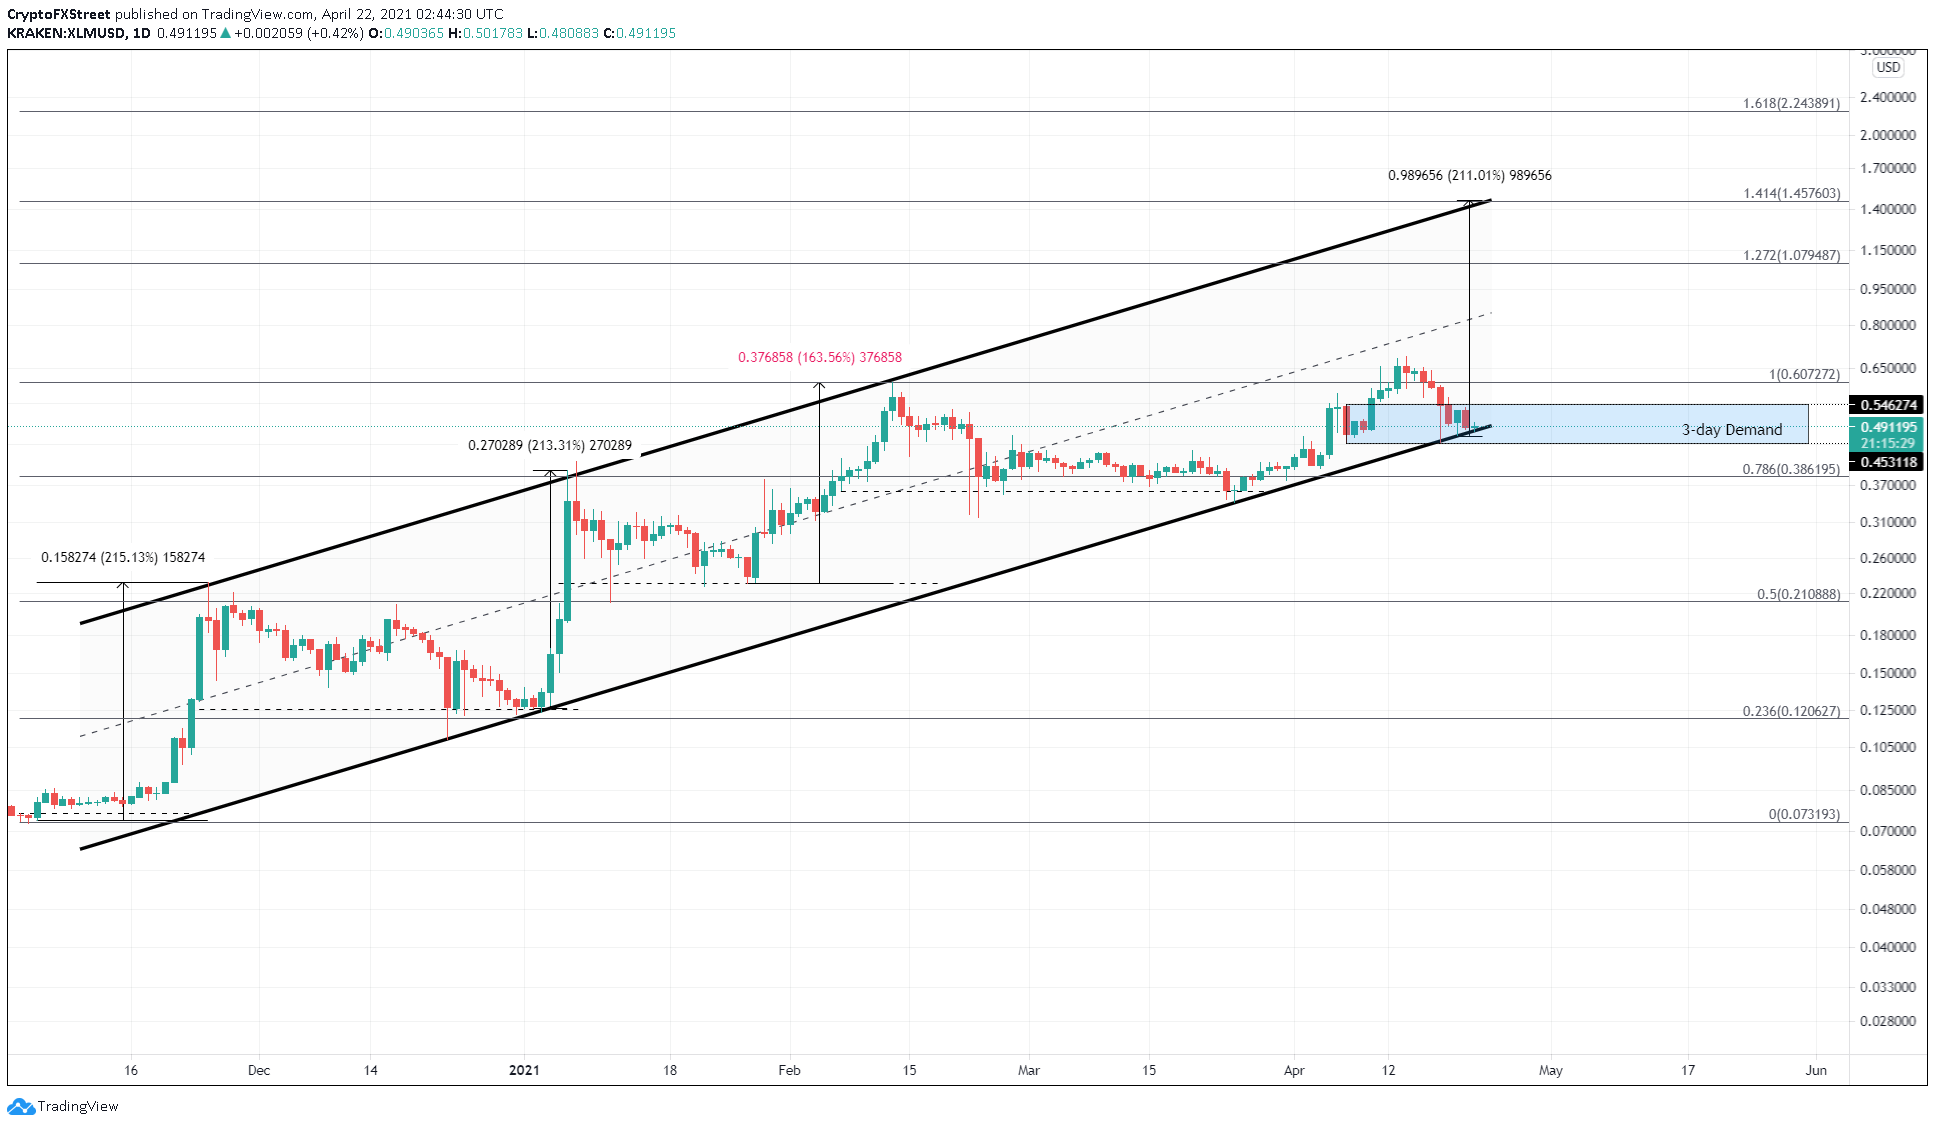
XLM price has been on an uptrend, creating multiple higher highs and higher lows, resulting in an ascending parallel channel when connected using trend lines.
Stellar’s latest attempt at a rally failed just before the middle line of the setup as sellers overwhelmed the bullish momentum. This move has led XLM price to enter the 3-day demand zone that extends from $0.453 to $0.546. If this level sustains, it will provide XLM an opportunity to set up new highs after a hyperbolic leg-up.
Adding credence to this upswing is Stellar’s history within this parallel channel. The last three taps at the channel's lower trend line saw a 150% to 200% upswing. Two out of three times, XLM price rallied 200%.
If history rhymes, investors can expect a similar bull run.
Therefore, the areas of interest include 127.2% and 141.4% Fibonacci extension levels at $1.08 and $1.45, respectively.
XLM/USDT 1-day chart
However, market participants should note that the bullish thesis sits on the assumption that XLM price bounces off the ascending parallel channel’s lower trend line. If the sellers invoke a daily candlestick close below $0.422, it will invalidate the upswing scenario and kick-start a bearish one.
In such a scenario, XLM price could drop 5% to $0.401.
Author

Akash Girimath
FXStreet
Akash Girimath is a Mechanical Engineer interested in the chaos of the financial markets. Trying to make sense of this convoluted yet fascinating space, he switched his engineering job to become a crypto reporter and analyst.


