- Chainlink sees its weekly gains evaporate in the last trading hours during the closing session on Sunday.
- LINK price still holds a solid 25% return going forward.
- Once one of the caps is hit, expect to see a big fade or even a reversal back to lower levels.
Chainlink (Link) price sees a big piece of its weekly gains go up in the air on Sunday night, while LINK price action can still close the week with a profit. The rally stays intact with a winning streak of five consecutive gains. Although there are still 20% of gains or more on the table, the rally starts to near its end game as a powerful cap is set to kick in and trigger a big fade to the downside.
LINK price on a final stretch
Chainlink price has had a very good winning streak, even withstanding some headwinds that came from several Fed officials issuing warnings about the rate expectations of the markets and the current recovery rally. Although even several investors and big hedge funds have warned about the sustainability of the summer rally in equities and cryptocurrencies, LINK price still holds some room in its tank to pop higher before hitting a key resistance level. With still a 20% profit on the table, traders should be aware that a turnaround is coming soon.
First up for LINK price is the $10 handle, just above the monthly R2 resistance level. The best scenario would be a weekly close and open next week above this area with a test or possible break on the 200-day Simple Moving Average (SMA) at $11.14. That level coincides with the monthly R3 resistance level and is slightly above $12.17 as a key cap on the price action.
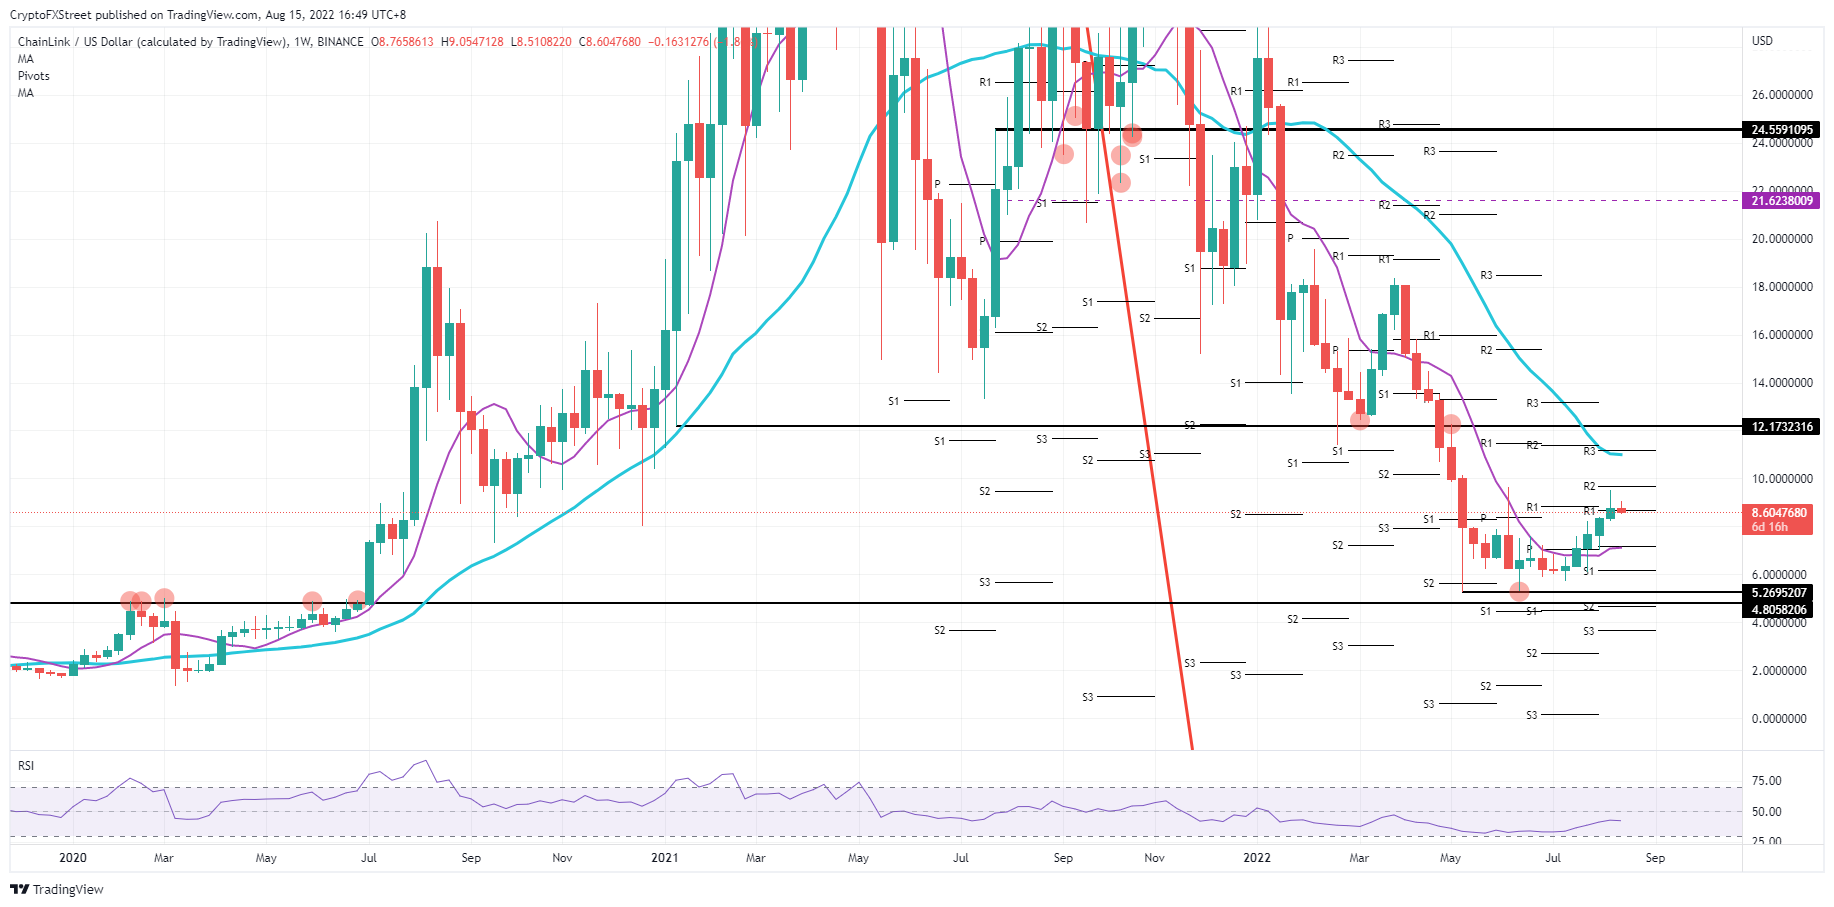
LINK/USD Weekly chart
As mentioned in the opening paragraph, risk comes with possible rejection and, next, a fade or full collapse of the price action. For support, the monthly pivot would come into play at $7.10 together with the 55-day SMA. Worst case price action would drop back to $5.26, which would mean an over 40% reduction in its valuation.
Information on these pages contains forward-looking statements that involve risks and uncertainties. Markets and instruments profiled on this page are for informational purposes only and should not in any way come across as a recommendation to buy or sell in these assets. You should do your own thorough research before making any investment decisions. FXStreet does not in any way guarantee that this information is free from mistakes, errors, or material misstatements. It also does not guarantee that this information is of a timely nature. Investing in Open Markets involves a great deal of risk, including the loss of all or a portion of your investment, as well as emotional distress. All risks, losses and costs associated with investing, including total loss of principal, are your responsibility. The views and opinions expressed in this article are those of the authors and do not necessarily reflect the official policy or position of FXStreet nor its advertisers. The author will not be held responsible for information that is found at the end of links posted on this page.
If not otherwise explicitly mentioned in the body of the article, at the time of writing, the author has no position in any stock mentioned in this article and no business relationship with any company mentioned. The author has not received compensation for writing this article, other than from FXStreet.
FXStreet and the author do not provide personalized recommendations. The author makes no representations as to the accuracy, completeness, or suitability of this information. FXStreet and the author will not be liable for any errors, omissions or any losses, injuries or damages arising from this information and its display or use. Errors and omissions excepted.
The author and FXStreet are not registered investment advisors and nothing in this article is intended to be investment advice.
Recommended Content
Editors’ Picks
Sui technical outlook hints at a possible double-bottom formation
Sui (SUI) price action hints at a double-bottom technical formation, which tends to be followed by a bullish move. The Coinglass long-to-short ratio for SUI stands above one and rises, indicating more traders are betting for a rally in SUI.
Bitcoin consolidation continues as market prepares for the next major move
Bitcoin (BTC) has been consolidating between $94,000 and $100,000 since February 5. Glassnode reports weakening capital inflows and declining derivatives activity, with short-term holder accumulation resembling challenging market conditions.
Stellar Price Forecast: XLM’s Total Value Locked reaches over $62 million
Stellar (XLM) price trades inside a channel pattern; a breakout indicates bullish momentum. Crypto intelligence tracker DefiLlama data shows that XLM’s TVL reaches $62 million while the technical outlook projects a target of $0.74.
XRP record gains as SEC acknowledges CoinShares, Canary and WisdomTree's XRP ETF filings
SEC accelerates the XRP ETF filing process by acknowledging CoinShares, Canary and WisdomTree's applications. The new SEC administration has yet to pause the agency's litigation against Ripple due to prioritization of cases with imminent court deadlines.
Bitcoin: BTC consolidates before a big move
Bitcoin price has been consolidating between $94,000 and $100,000 for the last ten days. US Bitcoin spot ETF data recorded a total net outflow of $650.80 million until Thursday.
The Best brokers to trade EUR/USD
SPONSORED Discover the top brokers for trading EUR/USD in 2025. Our list features brokers with competitive spreads, fast execution, and powerful platforms. Whether you're a beginner or an expert, find the right partner to navigate the dynamic Forex market.