- Solana price has multiple bullish signs coming together, signaling a bright future.
- The breakout above $21.34, combined with the supporting momentum indicators, forecast a minimum of 28% upswing.
- A breakdown of the $18.70 support floor will invalidate the bullish thesis for SOL.
Solana price shows quite a few developments on the daily chart, all of which point to a bullish future for SOL holders. Investors can expect a quick run-up, which could develop into a medium-term uptrend if these optimistic conditions remain bullish.
Also read: Solana Price Forecast: A break above $26.30 would spell doom for bears
Solana price ready for a breakout
Solana price formed an inverse head-and-shoulders setup on the daily chart, below the $21.34 resistance level. On June 4, SOL breached this hurdle and flipped it into a potential support floor. Iif the ongoing pullback holds above $21.34 after a thorough retest, investors can expect the uptrend to continue.
Further supporting this narrative is the Relative Strength Index (RSI), which has flipped above the mean line and is currently bouncing off of it. Likewise, the Awesome Oscillator (AO) has also risen above the zero line.
Both the momentum indicators suggest a rising bullish trend is in play for Solana price, hinting at a recovery rally after weeks of non-stop downtrend.
The low-hanging fruit for Solana price and traders is $27.35, which is roughly 28% away from $21.34. If SOL bulls manage to maintain the momentum, a retest of the $31.29 hurdle is also on the cards. This move would mean a 46% gain for holders.
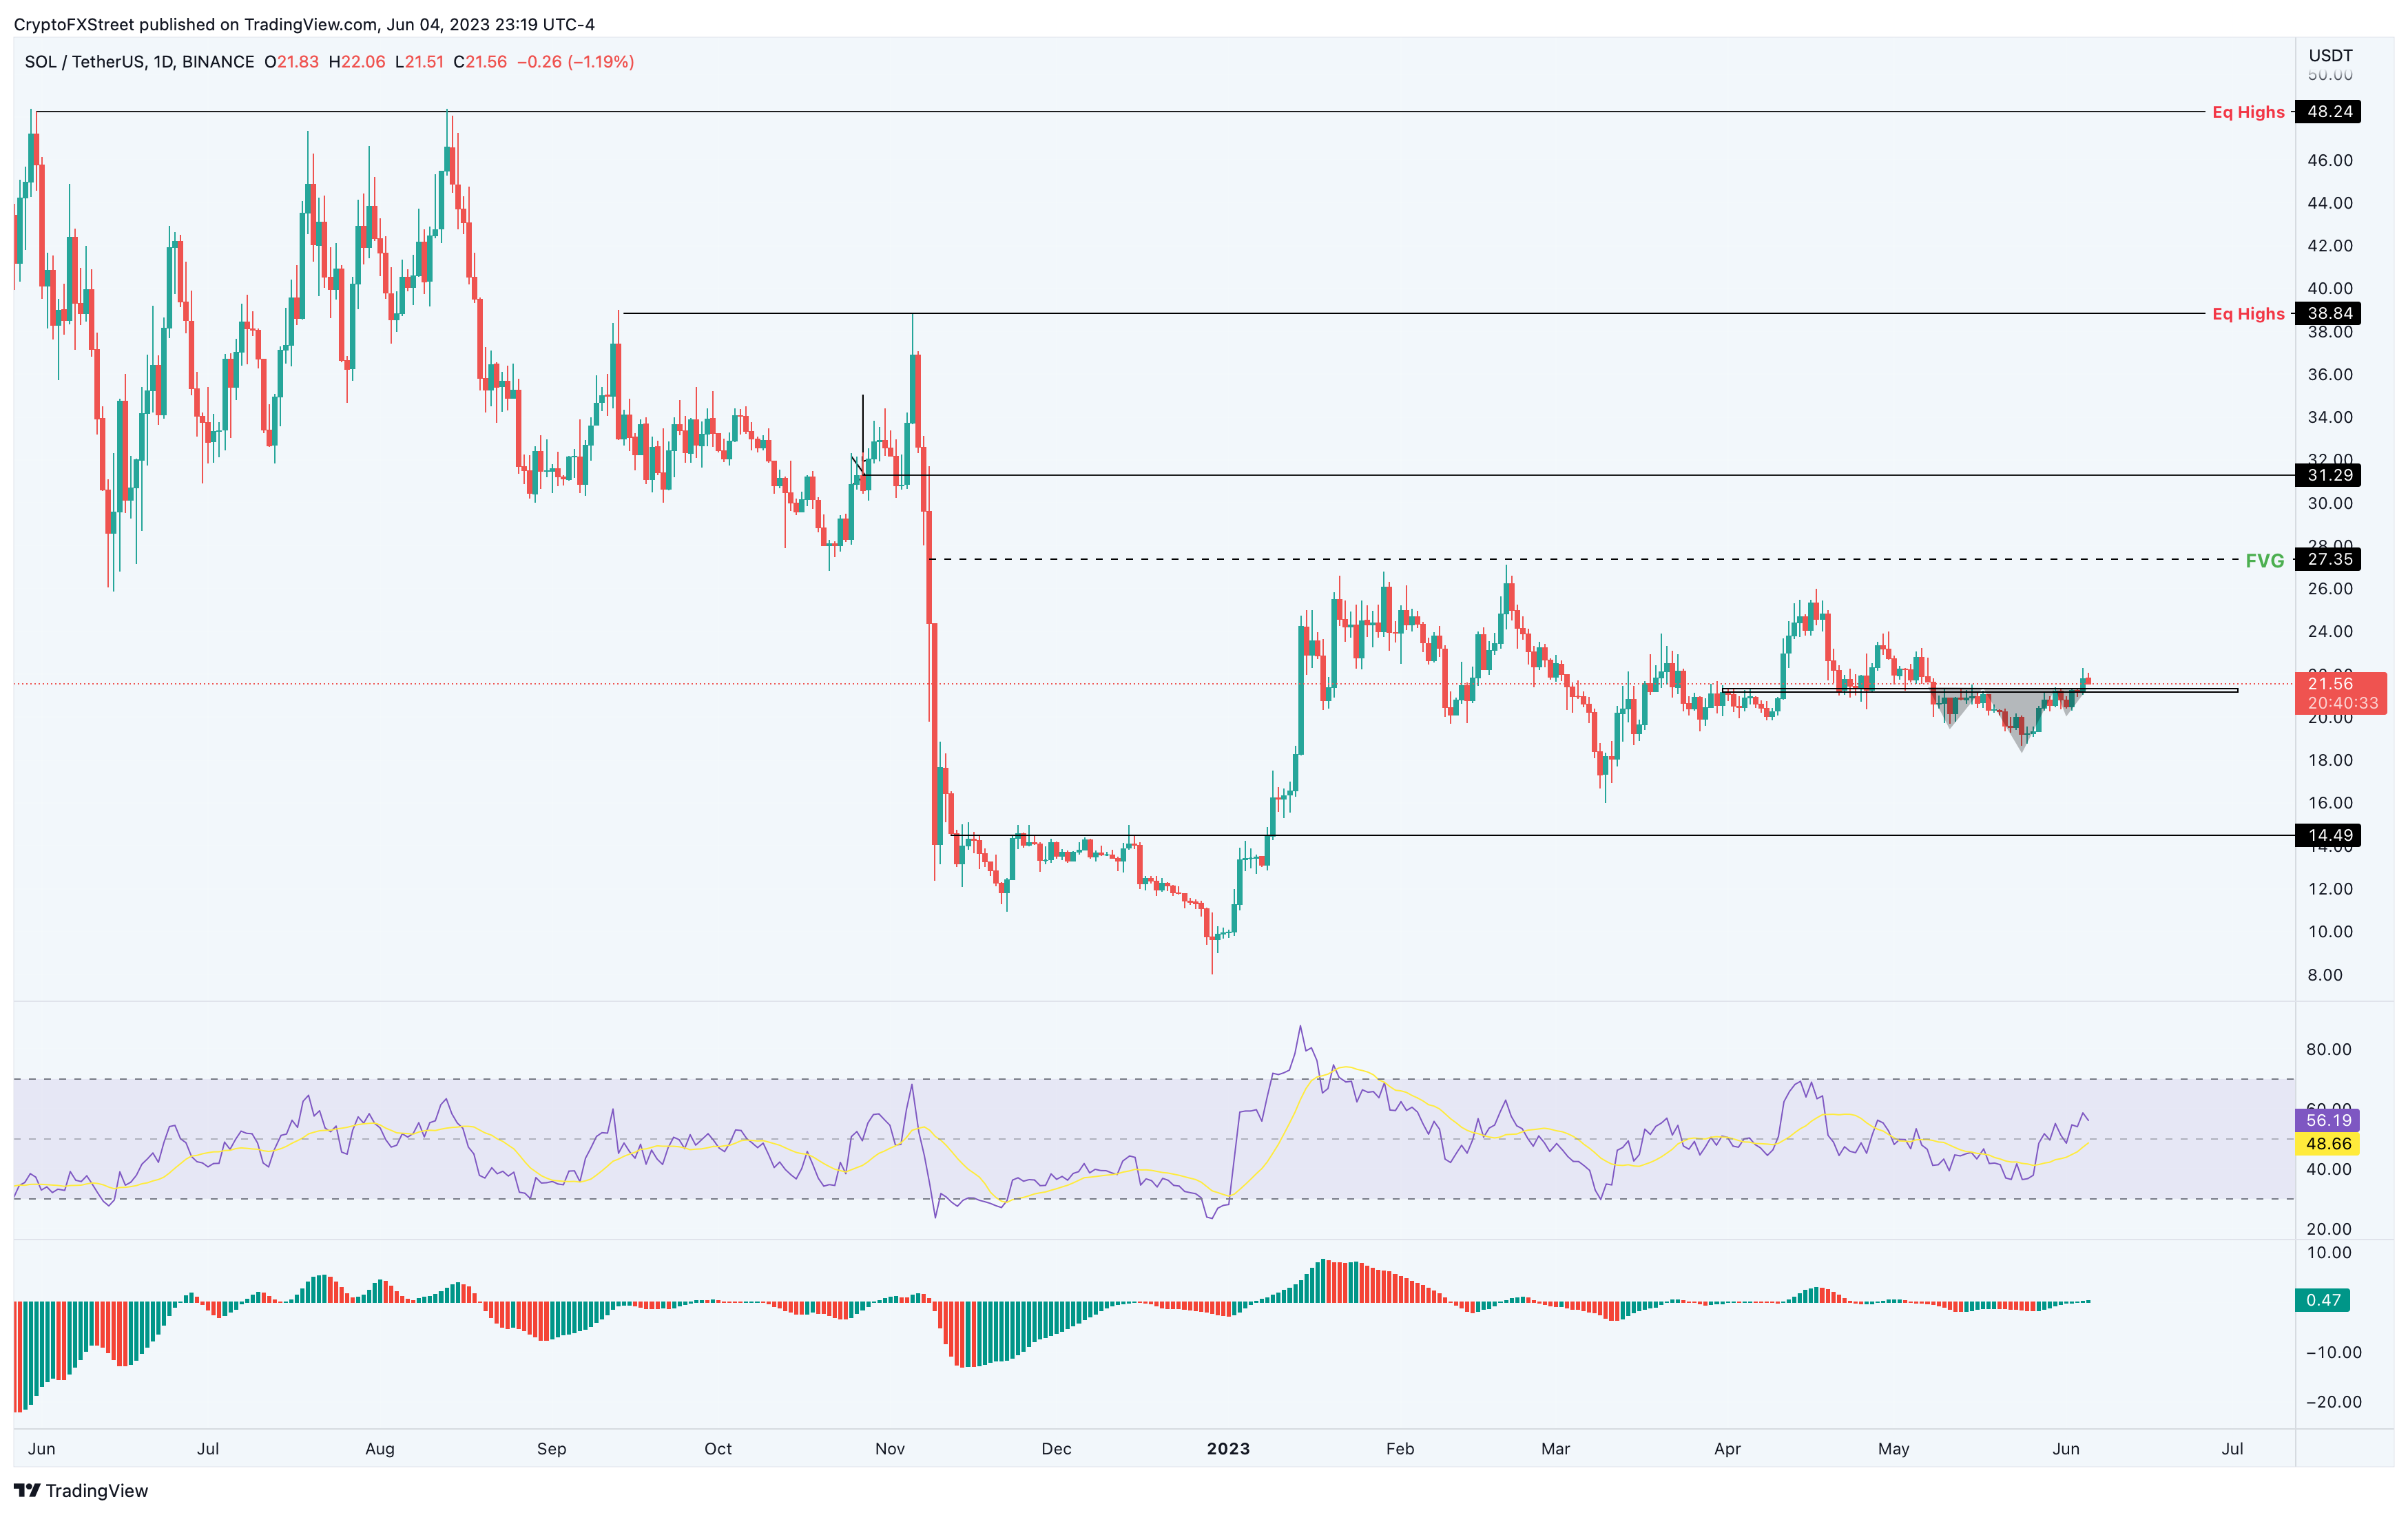
SOL/USDT 1-day chart
While the outlook for Solana price seems pretty optimistic, investors need to be cautious about Bitcoin’s uncertainty. A sudden downside spiral in BTC could drag altcoins, including SOL with it.
In such a case, if Solana price produces a daily candlestick close below $18.70 and flips it into a resistance level, it will invalidate the bullish thesis. This bearish move would attract more sellers and potentially trigger a 22% slide to $14.49.
Information on these pages contains forward-looking statements that involve risks and uncertainties. Markets and instruments profiled on this page are for informational purposes only and should not in any way come across as a recommendation to buy or sell in these assets. You should do your own thorough research before making any investment decisions. FXStreet does not in any way guarantee that this information is free from mistakes, errors, or material misstatements. It also does not guarantee that this information is of a timely nature. Investing in Open Markets involves a great deal of risk, including the loss of all or a portion of your investment, as well as emotional distress. All risks, losses and costs associated with investing, including total loss of principal, are your responsibility. The views and opinions expressed in this article are those of the authors and do not necessarily reflect the official policy or position of FXStreet nor its advertisers. The author will not be held responsible for information that is found at the end of links posted on this page.
If not otherwise explicitly mentioned in the body of the article, at the time of writing, the author has no position in any stock mentioned in this article and no business relationship with any company mentioned. The author has not received compensation for writing this article, other than from FXStreet.
FXStreet and the author do not provide personalized recommendations. The author makes no representations as to the accuracy, completeness, or suitability of this information. FXStreet and the author will not be liable for any errors, omissions or any losses, injuries or damages arising from this information and its display or use. Errors and omissions excepted.
The author and FXStreet are not registered investment advisors and nothing in this article is intended to be investment advice.
Recommended Content
Editors’ Picks
Shiba Inu Price Forecast: SHIB holders unload 61.5 billion tokens in the last ten days
Shiba Inu (SHIB) price is hovering around $0.000013 on Tuesday after dropping nearly 12% the previous day. Supply Distribution data shows that whale wallets have decreased SHIB holdings in the last ten days.
XRP eyes further downside as Trump to implement tariffs on Mexico, Canada, in March
Ripple's XRP joined the wider crypto market decline, plunging nearly 10% on Monday following President Donald Trump reiterating that the US will kick off tariffs on Mexico and Canada.
Raydium drops 35% on speculation of PumpFun’s Automated Market Maker development
Raydium (RAY) price trades around $3 on Tuesday after dropping almost 35% the previous day. This price crash was due to the rumors of a competing Automated Market Maker being developed by PumpFun and losing $334 million in market capitalization
Crypto Today: USDC approved in Dubai, SOL, ETH and BTC in turmoil, as Trump tariffs spark $200B losses
Cryptocurrency markets declined 7% on Monday, as cascading $208 billion liquidations shaved $80 billion off the sector’s aggregate valuation.
Bitcoin: BTC demand and liquidity conditions remain weak
Bitcoin price has been consolidating between $94,000 and $100,000 since early February, hovering around $98,000 at the time of writing on Friday. Despite this consolidation, US Bitcoin spot ETFs data recorded a total net outflow of $489.60 million until Thursday, hinting signs of weakness among institutional investors.
The Best brokers to trade EUR/USD
SPONSORED Discover the top brokers for trading EUR/USD in 2025. Our list features brokers with competitive spreads, fast execution, and powerful platforms. Whether you're a beginner or an expert, find the right partner to navigate the dynamic Forex market.