Why Shiba Inu is still set to pop 30% in August
- Shiba Inu is facing upside resistance from the high of last week.
- SHIB price undergoes a bullish squeeze as higher lows are set to the scene to break the double top.
- Expect once that double top breaks to see SHIB rally towards $0.0001708 in a due breakout.
Shiba Inu (SHIB) price is still set to rally quite sharply towards $0.0001708, a very tactical level at the top of the R3 resistance level for this month and perfect as the completion of a swing trade since mid-June. Several technical elements thus provide tailwinds for SHIB price action in which it can rally. Although a pullback might be possible, seeing some dollar strength that comes back, keeping it at the end of this week's trading, expect to see price action well supported by the 55-day Simple Moving Average.
SHIB price set to swing higher
Shiba Inu price is enjoying the summer and moving positively in a thin liquidity market with traders slowly but surely coming back from summer recess. SHIB price tieing up again with gains and looks even set to close out august with a gain after July had already printed solid numbers. On the horizon, a few elements to be aware of as the dollar strength persisted and did not see any follow through of its weakness this week, and some tail risks are getting inflated again as traders pick up from where they left off.
SHIB price first needs to break the double top around $0.00001276 with preferably a weekly close above. Once that is settled, it is a straight line towards $0.00001708, with in between all three, the monthly resistances are in the way. As those are so close to one another, they can be ignored as they rather confirm the breakout than try to use them as entry levels seeing they are soo close to one another.
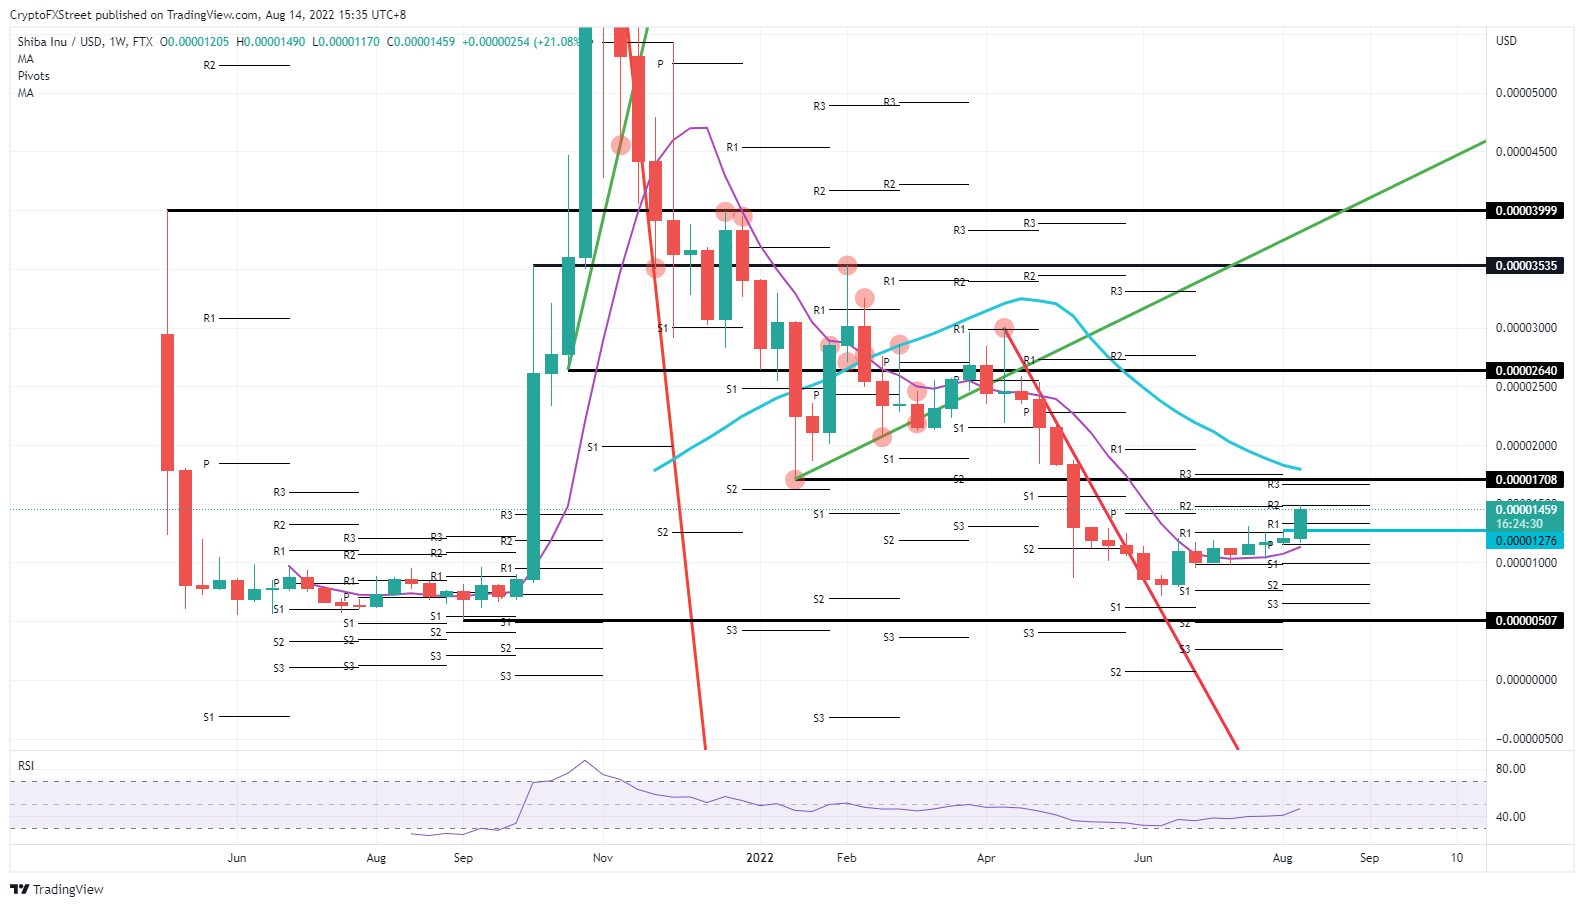
SHIB/USD Weekly chart
The risk to the downside is plain and simple, another rejection against that double top at $0.00001276, which could trigger quite the fade to the downside. Bulls would get pushed against the monthly pivot and the 55-day SMA, mounting pressure on it. Should that level give way, a quick paring back of gains would happen to $0.00000507 and coincide with 55% of losses.
Author

Filip Lagaart
FXStreet
Filip Lagaart is a former sales/trader with over 15 years of financial markets expertise under its belt.


