Why Polkadot price needs to crash more before triggering an explosive rally
- Polkadot price shattered the $15.97 support level and crashed 11%.
- DOT is likely to slide another 12% before retesting the $10.37 to $12.93 demand zone.
- A daily candlestick close below $10.37 will invalidate the bullish thesis.

Polkadot price is in a tough spot after breaching a significant support level. This development is likely to trigger a further descent before finding a stable support floor. Here, DOT bulls are likely to make a comeback and trigger a new run-up.
Polkadot price needs to go lower
Polkadot price formed a double top at roughly $23.27 on February 6 and April 1. Since the second local top, DOT has crashed 40%, flipped the $15.97 support level into a resistance barrier and is currently hovering around $14.89.
As Polkadot price hovers in no man’s land, there is a good chance this downtrend will continue. The three-day demand zone, extending from $10.37 to $12.93 is a major support area where DOT buyers are going to make a comeback.
Any premature run-ups are likely going to face rejection at the $15.97 hurdle.
Therefore, a downswing of at least 12% is likely in the coming days for Polkadot price, which will retest the said demand zone. In some cases, the sellers might push DOT deeper into the support area before exhausting.
The resulting rally needs to breach the $15.97 and flip it into a support level before triggering a larger move to the $23.27 hurdle. In total, Polkadot price is preparing for a potential gain of 78%, but such a move will only occur after the anticipated 12% drop.
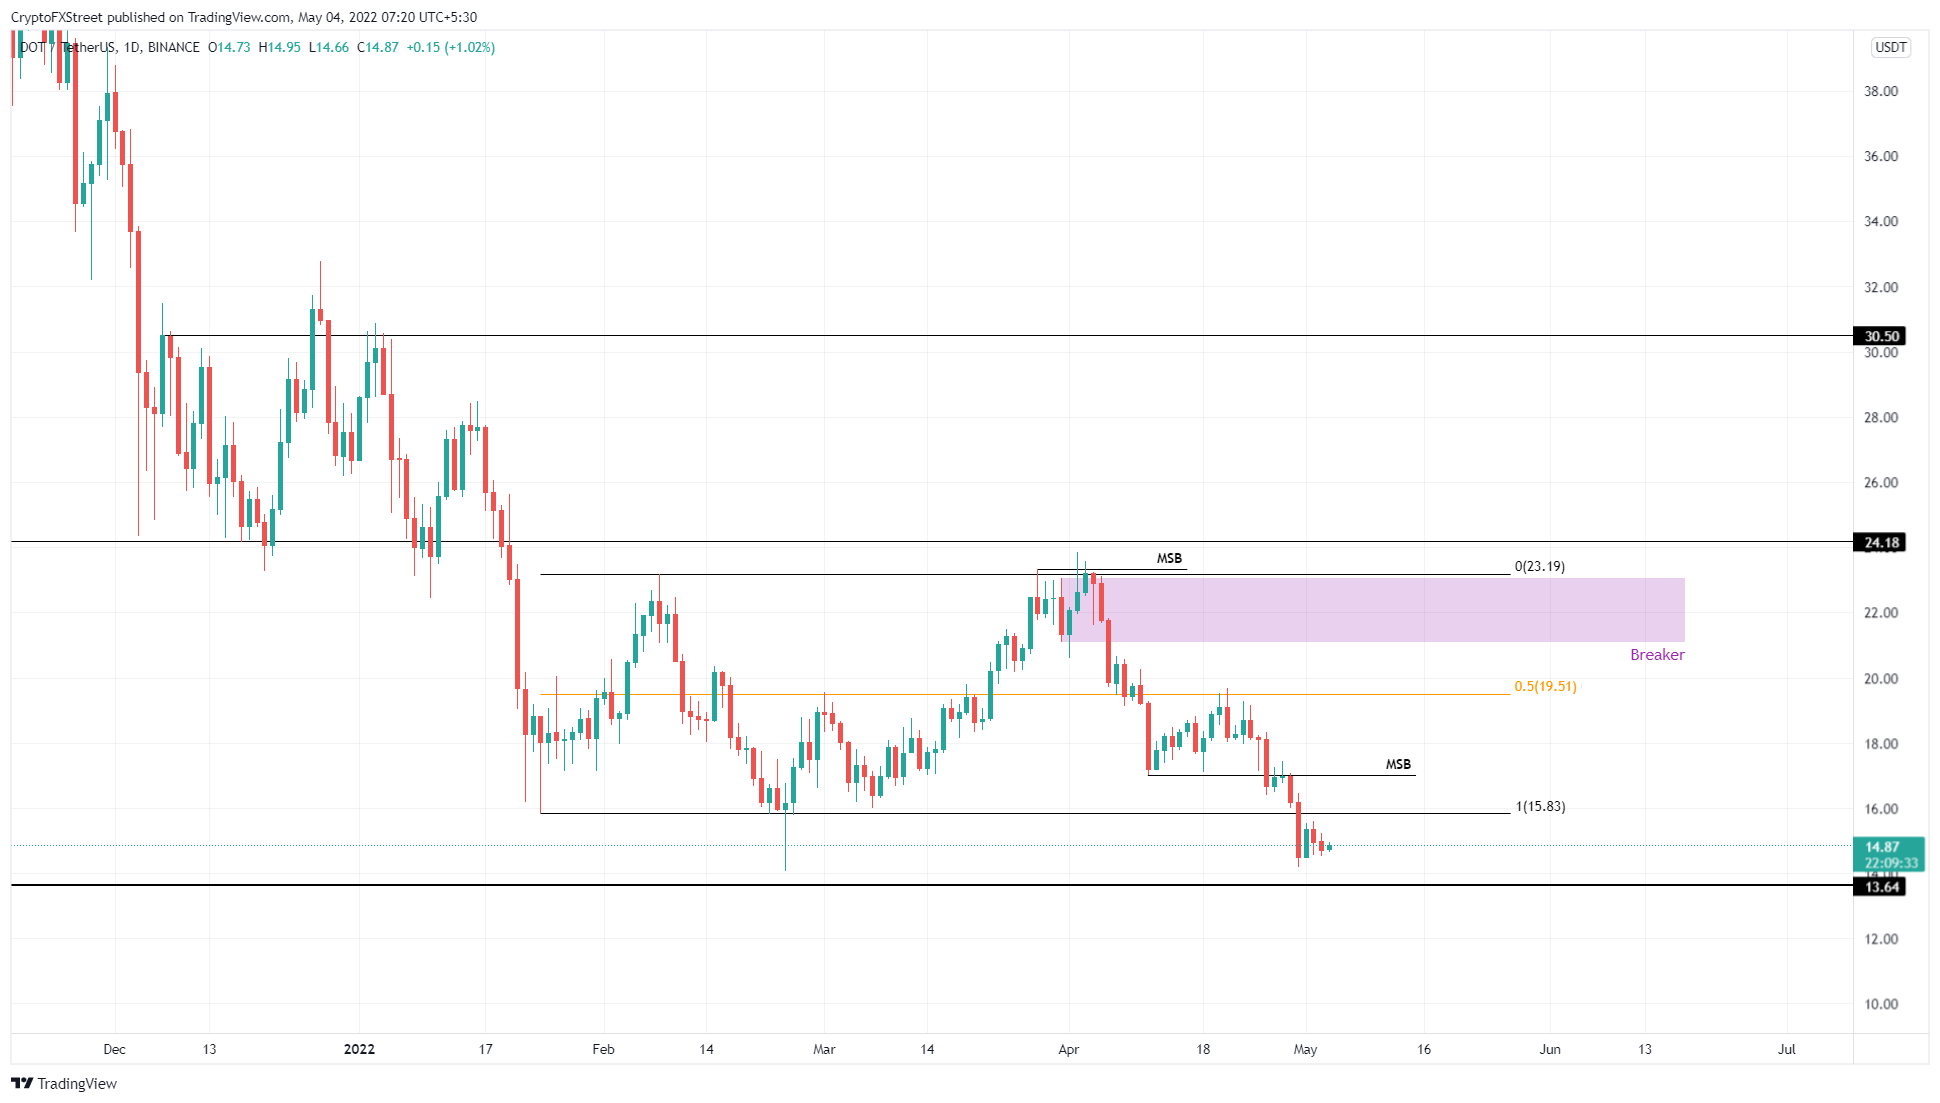
DOT/USDT 1-day chart
While things are looking up for Polkadot price, a daily candlestick close below the demand zone’s lower limit at $10.37 will invalidate the bullish thesis by producing a lower low. Under these conditions, investors can expect DOT to revisit the $8.31 support level.
Author

Akash Girimath
FXStreet
Akash Girimath is a Mechanical Engineer interested in the chaos of the financial markets. Trying to make sense of this convoluted yet fascinating space, he switched his engineering job to become a crypto reporter and analyst.


