How Mantra token’s dramatic 90% crash wiped out $5.2B market share
- Mantra’s OM token plunges by a staggering 90% on Sunday amid allegations of insider trading.
- Mantra team’s alleged control of 90% of the token supply sparks insider pump-and-dump concerns.
- The Mantra team refutes insider dumping allegations, attributing the crash to reckless liquidations.
- OM price trades at $0.83 in the wake of a resounding plunge from $6.33 on Sunday.

Mantra (OM) price hovered at $0.83 during the Asian session on Monday, following a massive 90% crash from $6.33 on Sunday. The crash wiped out $5.2 billion in the token’s market capitalization, quickly drawing comparisons to the infamous collapse of Terra LUNA and FTX in 2022. Mantra’s team has been accused of insider trading amid questionable token transfers.
Mantra price crash: Insider dumping or reckless liquidations?
Mantra, the security-first real-world asset (RWA) layer 1 blockchain built for institutions and developers, is in the crosshairs after its native OM token plummeted 90% on Sunday. The crash triggered $68.86 million in 24-hour liquidations, with long positions being hit the hardest at $49.68 million, while short positions lost $19.18 million, per Coinglass data.
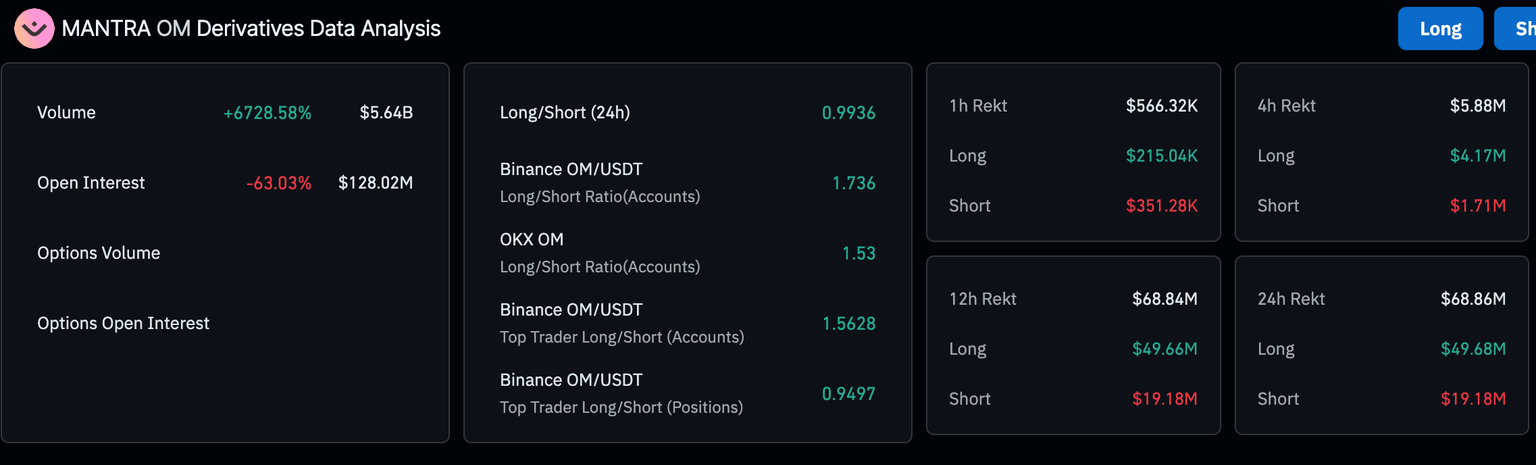
Mantra liquidation data | Source: Coinglass
Multiple sources in the crypto community have raised questions regarding the crash, with some alleging that the Mantra team controls 90% of the token supply and that it could have coordinated the sell-off.
According to a report by SpotOnChain, a platform tracking crypto transactions, a group of OM whales moved 14.27 million OM, approximately $91 million, to OKX three days before the crash at an average price of $6.375. Moreover, the same whales had jointly purchased 84.15 million OM, roughly $564.7 million, on Binance in March at an average price of $6.711.
Just within 3 days before the crash, this group of fresh $OM whales moved 14.27M $OM (~$91M) to #OKX at an average price of $6.375.
— Spot On Chain (@spotonchain) April 14, 2025
Back in late March, they had jointly scooped up 84.15M $OM from #Binance for ~$564.7M (avg. $6.711).
Now, after a brutal ~90% drop, their… https://t.co/H7EASdsZaG pic.twitter.com/VsePiGlStV
Despite the value of their remaining balance of 69.08 million OM plunging to $62.2 million, SpotOnChain argued that “they may have hedged the position elsewhere, and it’s possible they contributed to the sharp drop.”
Lookonchain, another wallet tracking service, highlighted that at least 17 wallets moved 43.6 million OM, worth around $227 million at the time, to exchanges. This massive transfer made up 4.5% of the Mantra token’s supply. As per Arkham’s tag, two of the addresses are directly linked to Laser Digital, a strategic investor in Mantra.
Who dropped the price of $OM?
— Lookonchain (@lookonchain) April 14, 2025
Before the $OM crash(since Apr 7), at least 17 wallets deposited 43.6M $OM($227M at the time) into exchanges, 4.5% of the circulating supply.
According to Arkham’s tag, 2 of these addresses are linked to Laser Digital.
Laser Digital is a strategic… pic.twitter.com/zB8yAPRPSO
In response to the allegations, the Mantra team said the project is “fundamentally strong.” The team added that Sunday’s crash resulted from “reckless liquidations” and that it did not have anything to do with the project’s management.
MANTRA community - we want to assure you that MANTRA is fundamentally strong. Today’s activity was triggered by reckless liquidations, not anything to do with the project. One thing we want to be clear on: this was not our team. We are looking into it and will share more details…
— MANTRA | Tokenizing RWAs (@MANTRA_Chain) April 13, 2025
What’s next for Mantra?
It is unclear what may have led to the devastating crash, which saw many traders and investors sink deeper into losses amid the ongoing trade war. The Mantra team has promised an investigation and will share more details about what transpired.
So far, a combination of factors, including potential structural vulnerabilities, especially the team's alleged 90% control of supply, large token deposits into exchanges, over-the-counter (OTC) deals, and forceful liquidations, could have triggered the crash.
Mantra’s OM token is heavily oversold on the daily chart based on the Relative Strength Index (RSI), suggesting that bears are in control as bullish momentum shrinks on Monday. The Moving Average Convergence Divergence (MACD) validates the downtrend, with the MACD holding at -0.3007.
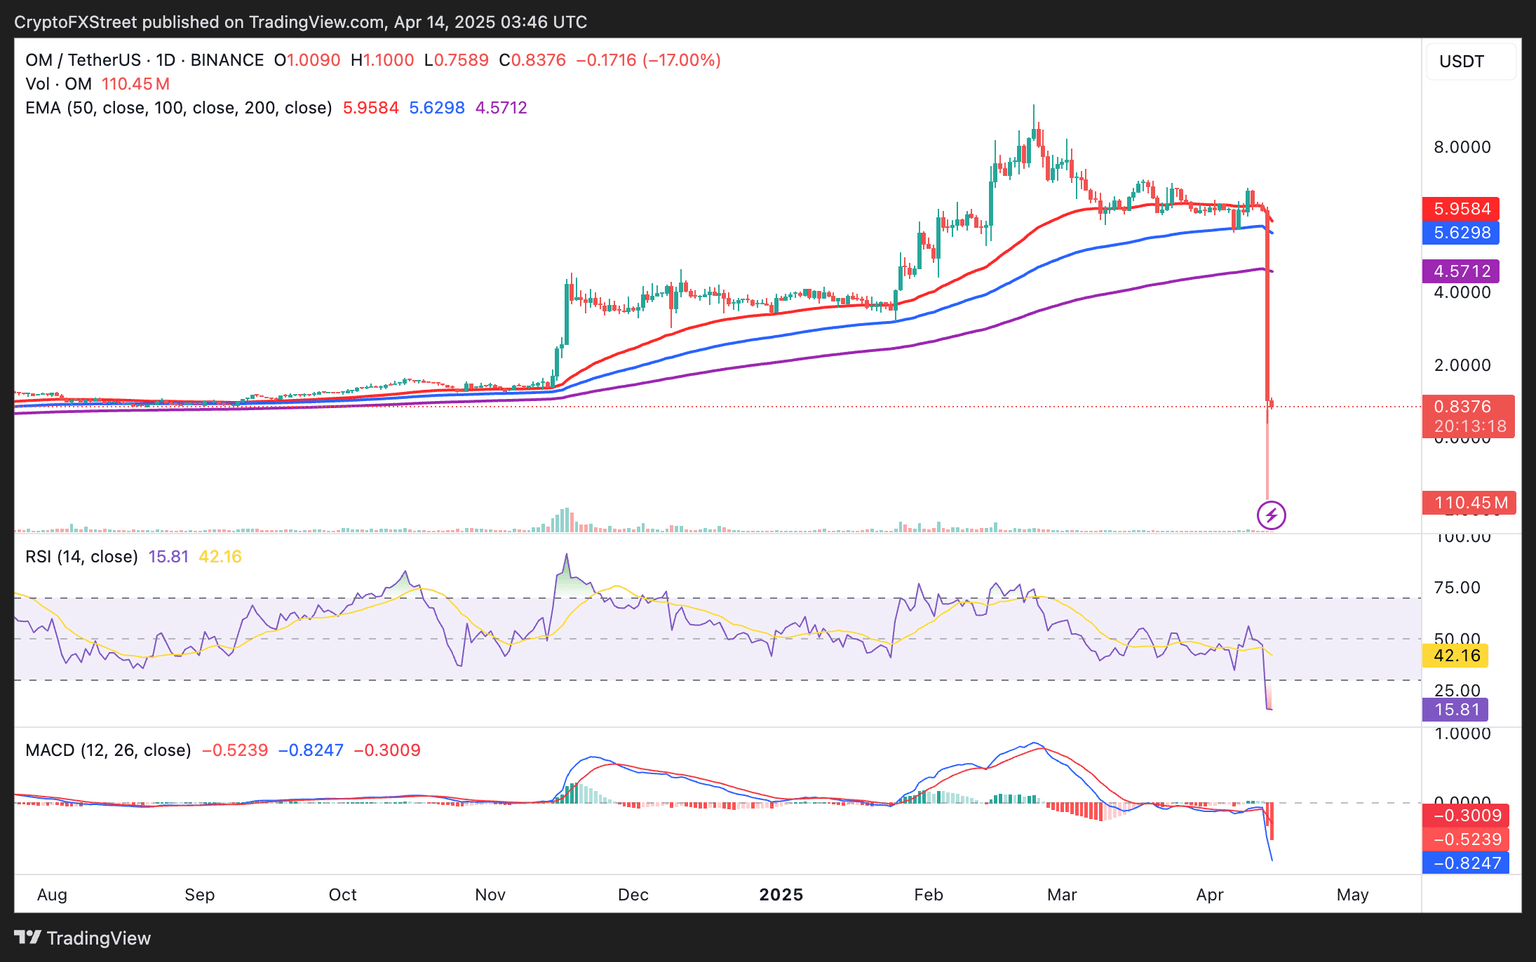
OM/USDT daily chart
The next few days will be critical to Mantra’s performance; hence, traders may want to exercise patience. A report from the team could shed more light on what caused the massive plunge in OM price, possibly paving the way for a recovery. However, it would be prudent to expect different scenarios, including a continued downtrend, keeping in mind growing concerns over market manipulation.
Author

John Isige
FXStreet
John Isige is a seasoned cryptocurrency journalist and markets analyst committed to delivering high-quality, actionable insights tailored to traders, investors, and crypto enthusiasts. He enjoys deep dives into emerging Web3 tren


