Why is Pepe meme coin rallying? What’s next after PEPE’s ATH?
- Pepe price hit an ATH of $0.0000147 on May 23 after a 65% gain in the last three days.
- Investors have two accumulation levels at $0.0000118 and $0.0000102 before the next leg.
- On-chain metrics show a spike in investor interest without major signs of selling pressure.

Pepe (PEPE) price shows signs of continuing its uptrend, but it might come after a correction. This short-term pullback could be used by sidelined buyers to accumulate PEPE for the next leg up.
Also read: Is the crypto bull run back?
Why Pepe is bullish?
Pepe price consolidated for 66 days between March 14 and May 19, building up orders. On May 20, the frog-themed meme coin breached the $0.0000058 to $0.0000108 range to the upside and kicked-started its 65% rally, which hit a new all-time high (ATH) of $0.0000147, where it currently trades.
The catalyst for this impulsive move in Pepe price can be attributed to the bullishness surrounding Ethereum spot Exchanged Traded Fund (ETF) approval. Since PEPE is an ERC-20 meme coin, the ETH-based news played a pivotal role in propelling the meme coin higher.
Read more: As Ethereum spot ETF approval nears, these altcoins could explode
PEPE buying opportunity
After Pepe price breached the $0.0000108 level, it soared up 65%, and this impulsive is likely done, at least in the short-term. Going forward, investors can expect one of two scenarios to play out.
Mean reversion: A 16% correction that pushes Pepe price down to $0.0000118, the midpoint of the 65% move. This is the first accumulation level.
Extended profit-taking: In case the selling pressure is too much, PEPE could most likely shatter $0.0000108, the upper limit of the aforementioned range and revisit the imbalance, extending from $0.0000108 to $0.00000959. This move would constitute nearly 25% drop from the current level and is another accumulation level.
Investors could choose to leave bids near both levels and capitalize on the next leg of the uptrend.
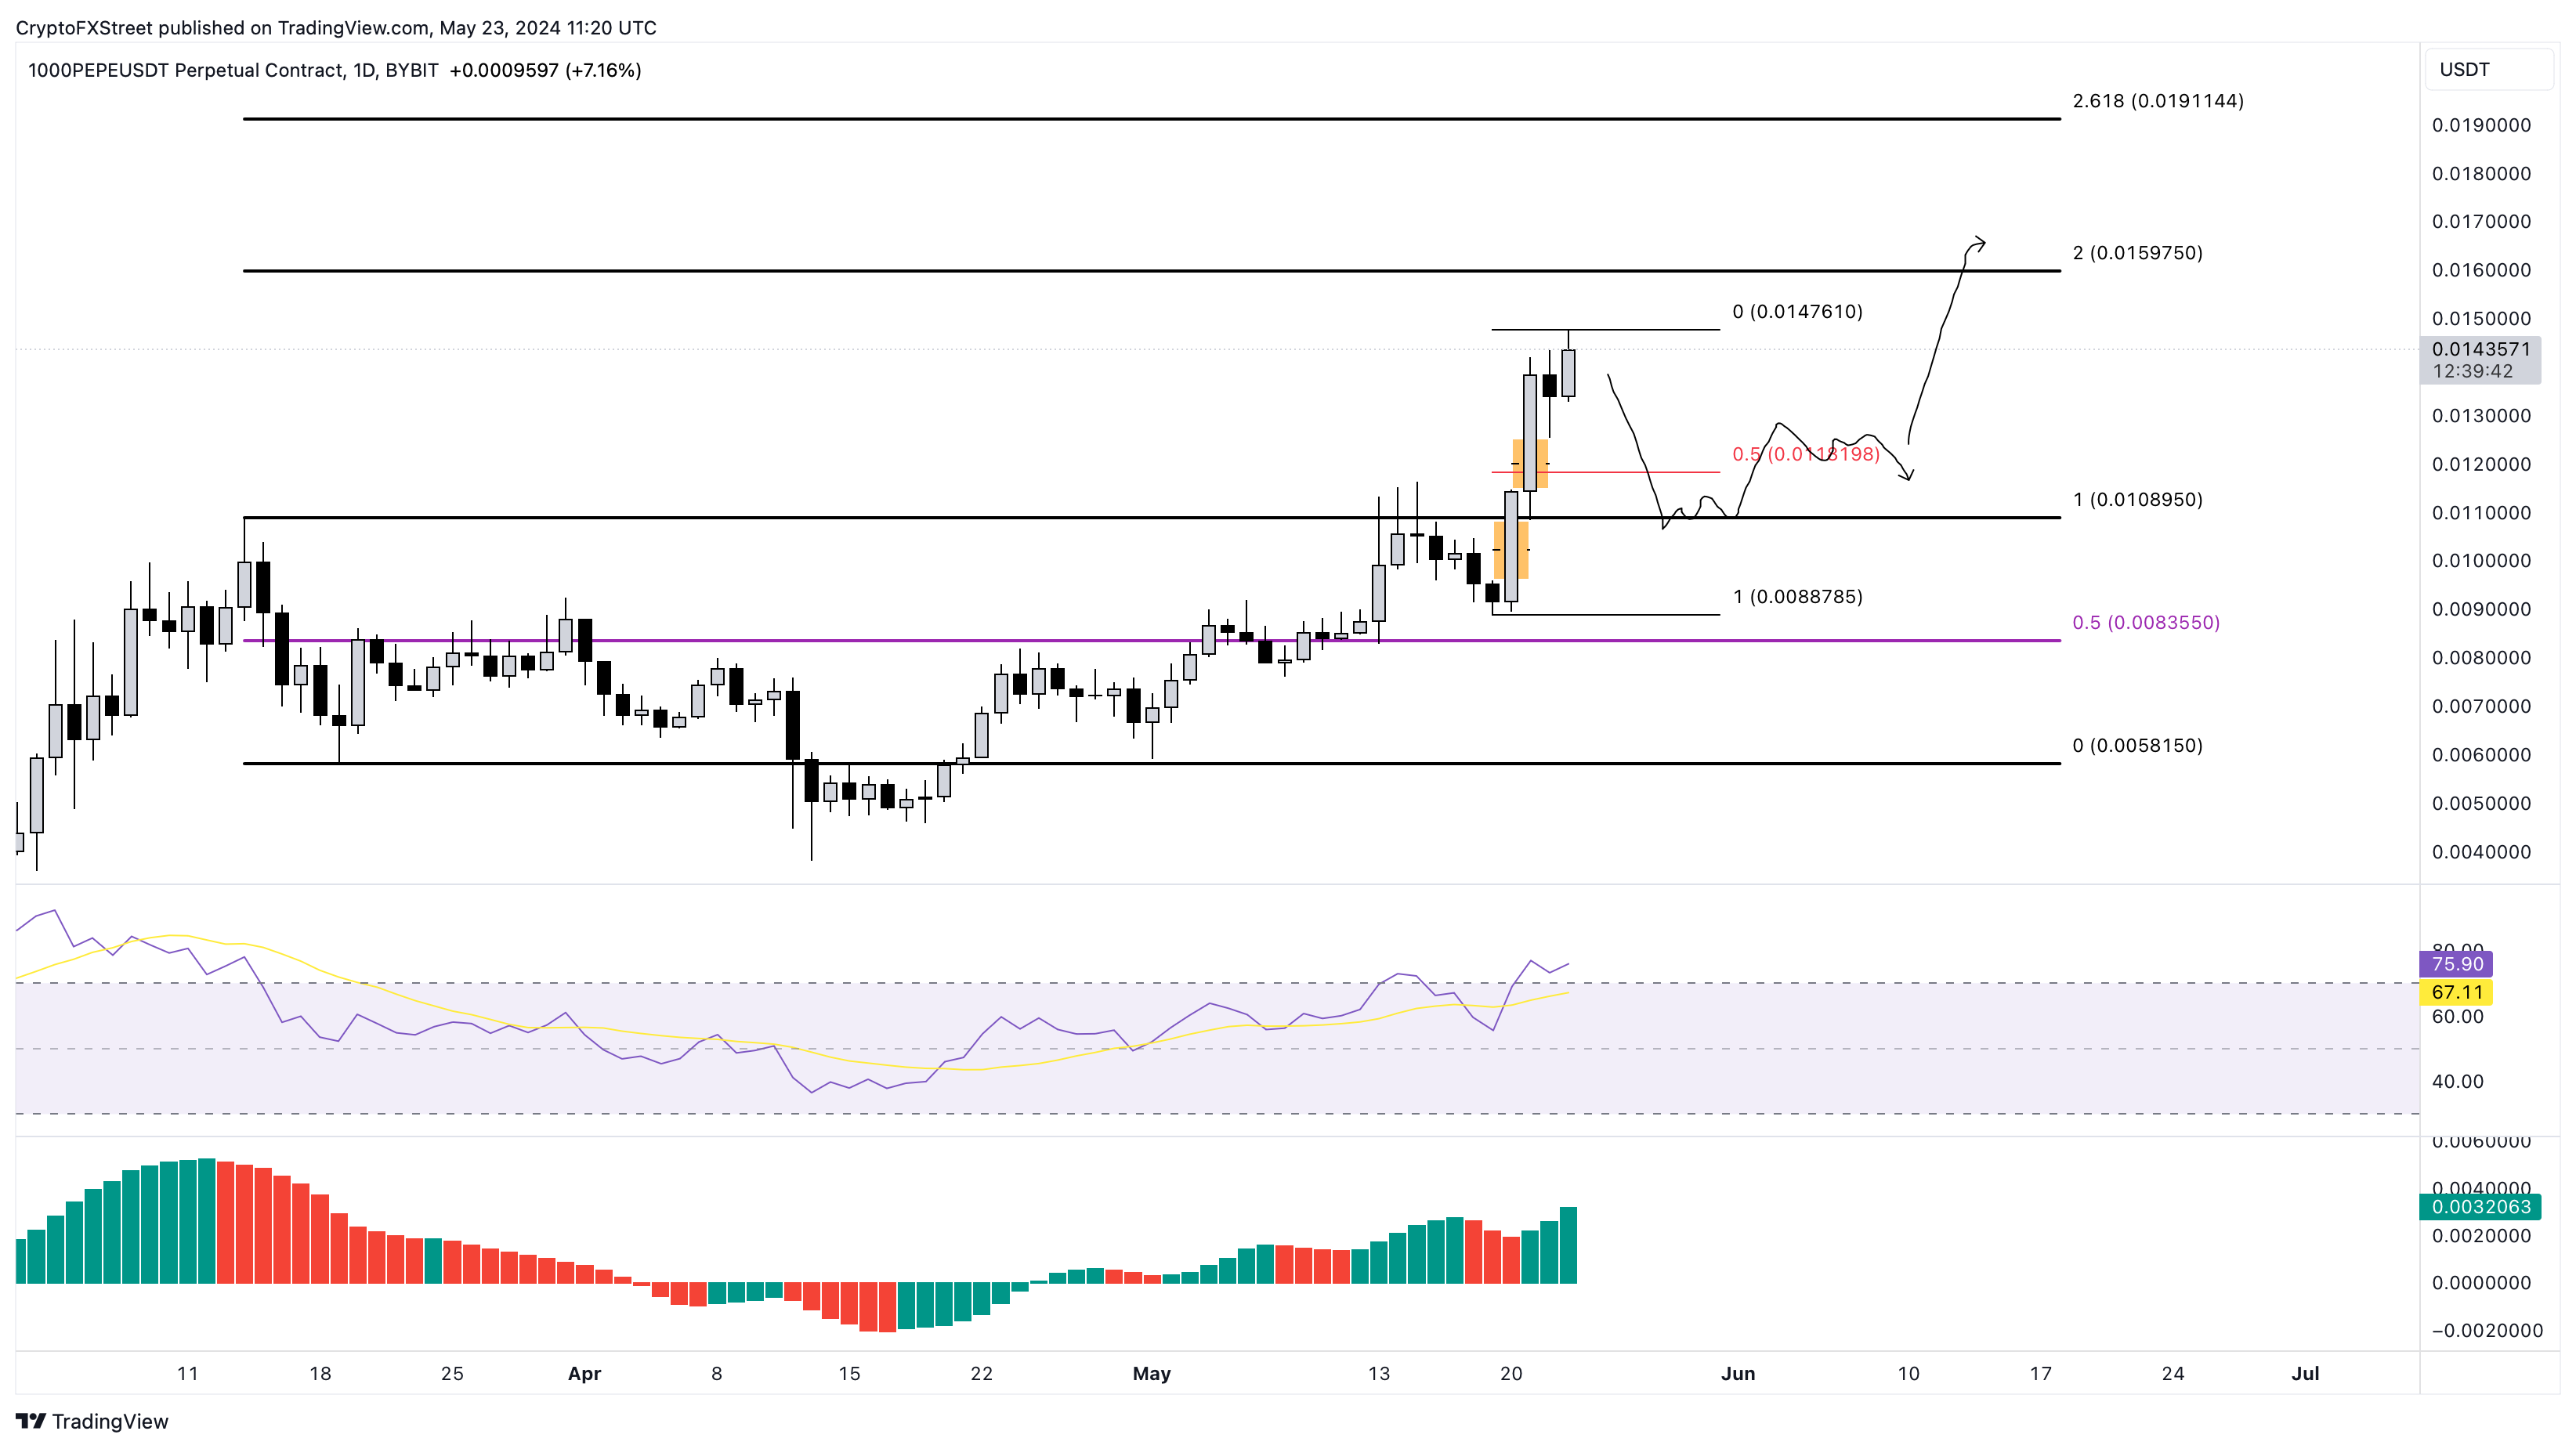
PEPE/USDT 1-day chart
Why is this ETH-based meme likely to rally more?
According to Santiment, the 24-hour Active Addresses, the wallets interacting with the Pepe blockchain, have spiked from 3,600 to 12,000 between May 21 and 22. This sudden uptick is similar to the spike in active addresses in mid-May, when PEPE shot up 36%.
This metric shows that the investors are interested in Pepe at the current price levels.
 [16.51.14, 23 May, 2024]-638520620106350537.png)
PEPE 24-hour Active Addresses
Furthermore, the 30-day Market Value to Realized Value (MVRV) shows 39%, suggesting that the average profit of investors who purchased PEPE in the past month is 39%. A higher MVRV value means that investors are sitting on unrealized profits and is considered a potential sell signal. In addition to this, past history needs to be taken into account for accurate results.
Over the past year, many reversals for Pepe price have occurred around 39%, but the February rally pushed the local top of PEPE from nearly 40% to 119%. During bull runs, investors are much more confident and are less likely to sell, which is why the MVRV reaches larger numbers before the market reverses.
With that in mind, investors can rest assured that the Pepe price is unlikely to form a local top here.
 [14.19.17, 23 May, 2024]-638520620351954477.png)
PEPE 30-day MVRV
While Pepe price looks comfortable after its 65% impulsive move, the uptrend could come undone in case the Ethereum spot ETF is either delayed or not approved. A breach of the $0.0000108 level would be the first sign of a bearish outlook.
If Pepe price produces a decisive daily candlestick close below $0.00000887, it would create a lower low and invalidate the bullish thesis. Such a development could see PEPE drop to $0.00000835, a key support level.
Premium
You have reached your limit of 3 free articles for this month.
Start your subscription and get access to all our original articles.
Author

Akash Girimath
FXStreet
Akash Girimath is a Mechanical Engineer interested in the chaos of the financial markets. Trying to make sense of this convoluted yet fascinating space, he switched his engineering job to become a crypto reporter and analyst.


