- XRP price coils up in a symmetrical triangle, hinting at an explosive 70% breakout.
- On-chain metrics support a bullish move but only after a well-planned fakeout.
- A three-day candlestick close below the July 18 swing low at $0.515 will invalidate the bullish thesis for Ripple.
XRP price is at a position that has historically returned massive gains for patient buyers. Therefore, investors need to keep a close eye on this remittance token as an explosive move is around the corner.
XRP price at inflection point
XRP price consolidation over the past year, extending from April 2021 to April 2022 produced a symmetrical triangle. This setup consists of a series of lower highs and higher lows which are connected using trend lines.
Unlike other patterns, this one does not have a directional bias and forecasts a 70% price swing upon breakout. The target is obtained by adding the distance between the first swing high and swing low to the breakout point.
At the time of writing, XRP price is hovering around the lower trend line of the triangle. The last two times, the remittance token tagged this barrier a massive upswing emerged. So, if history repeats itself, Ripple stands to trigger another run-up.
Assuming, XRP price produces a daily candlestick close above the upper trend line at $0.926, it will signal a liquidity run above the equal highs and also trigger a new uptrend to the forecasted target at $1.575.
Supporting this bounce from the symmetrical triangle’s lower trend line is the Relative Strength Index (RSI). This indicator tracks momentum and oscillates between 0 to 100. Generally accepted ranges include an oversold level below 30 and an overbought condition above 80.
As seen in the chart below, XRP price has a history of bouncing off the yellow range, extending from 30 to 36. The last two retests of the symmetrical triangle’s lower trend lines coincided with the RSI hitting this range and bouncing back.
Interestingly, the recent downtrend has also pushed RSI extremely close to RSI’s local bottom, which indicates the possibility of an upswing. Therefore, one of two things could happen here
XRP price slips below the symmetrical triangle and triggers a fakeout and bounce as RSI hits the local bottom, trapping sellers.
A consolidation along the lower trend line that pushes RSI to retest the yellow box, creating a bullish divergence. This development will likely result in a price move to the upside.
Regardless of what scenario takes place, investors can stand to gain a minimum of 70% if they accumulate after the breakout or roughly 140% from the current position - $0.648.
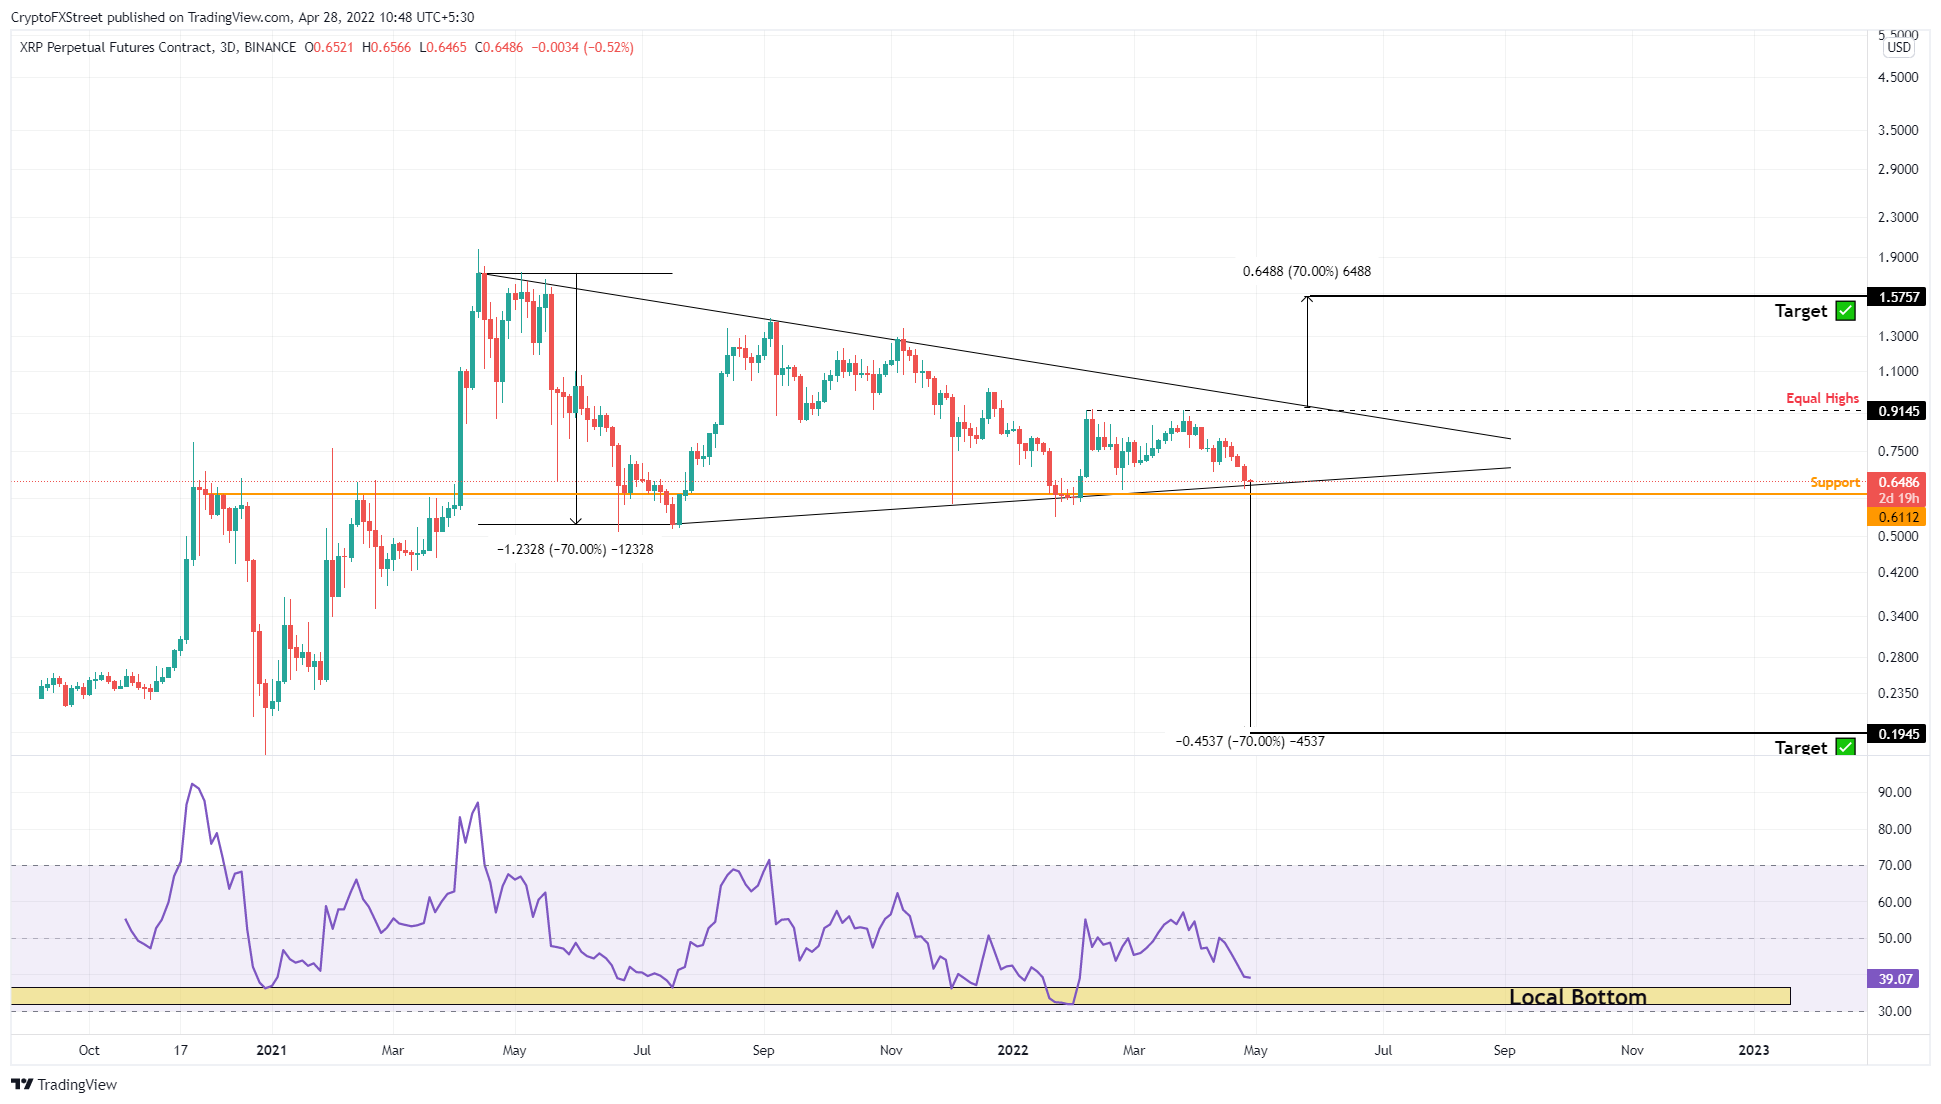
XRP/USDT 3-day chart
Adding credence to XRP’s bullish outlook is the 365-day Market Value to Realized Value (MVRV) model. This index is used to measure the average profit/loss of investors that purchased XRP tokens over the past year.
Based on multiple backtests, Santiment states that a value between -10% to -15% is where long-term holders accumulate since short-term holders are at a loss. As a result, this range is termed an “opportunity zone.”
For XRP, the 365-day MVRV is hovering around –27% and the data for the last two years shows that a local bottom formed at around -30%, indicating that a trend reversal could be around the corner, which also backs up the bullish technical forecast.
 [10.42.26, 28 Apr, 2022]-637867317197672828.png)
XRP 365-day MVRV
While things are looking massively bullish for XRP price, there could be a scenario where a fakeout could cause retail holders to capitulate, leading to a deeper correction. In such a case, a three-day candlestick close below the July 18 swing low at $0.515 will invalidate the bullish thesis for XRP price. In such a case, Ripple could continue sliding lower until it tags the $0.444 stable support level.
Information on these pages contains forward-looking statements that involve risks and uncertainties. Markets and instruments profiled on this page are for informational purposes only and should not in any way come across as a recommendation to buy or sell in these assets. You should do your own thorough research before making any investment decisions. FXStreet does not in any way guarantee that this information is free from mistakes, errors, or material misstatements. It also does not guarantee that this information is of a timely nature. Investing in Open Markets involves a great deal of risk, including the loss of all or a portion of your investment, as well as emotional distress. All risks, losses and costs associated with investing, including total loss of principal, are your responsibility. The views and opinions expressed in this article are those of the authors and do not necessarily reflect the official policy or position of FXStreet nor its advertisers. The author will not be held responsible for information that is found at the end of links posted on this page.
If not otherwise explicitly mentioned in the body of the article, at the time of writing, the author has no position in any stock mentioned in this article and no business relationship with any company mentioned. The author has not received compensation for writing this article, other than from FXStreet.
FXStreet and the author do not provide personalized recommendations. The author makes no representations as to the accuracy, completeness, or suitability of this information. FXStreet and the author will not be liable for any errors, omissions or any losses, injuries or damages arising from this information and its display or use. Errors and omissions excepted.
The author and FXStreet are not registered investment advisors and nothing in this article is intended to be investment advice.
Recommended Content
Editors’ Picks

Litecoin Price Prediction: LTC tries to retake $100 resistance as miners halt sell-off
Litecoin price grazed 105 mark on Monday, rebounding 22% from the one-month low of $87 recorded during last week’s market crash. On-chain data shows sell pressure among LTC miners has subsided. Is the bottom in?

Bitcoin fails to recover as Metaplanet buys the dip
Bitcoin price struggles around $95,000 after erasing gains from Friday’s relief rally over the weekend. Bitcoin’s weekly price chart posts the first major decline since President-elect Donald Trump’s win in November.

SEC Commissioner Hester Pierce sheds light on Ethereum ETF staking under new administration
In a Friday interview with Coinage, SEC Commissioner Hester Peirce discussed her optimism about upcoming regulatory changes as the agency transitions to new leadership under President Trump’s pick for new Chair, Paul Atkins.

Bitcoin dives 3% from its recent all-time high, is this the cycle top?
Bitcoin investors panicked after the Fed's hawkish rate cut decision, hitting the market with high selling pressure. Bitcoin's four-year market cycle pattern indicates that the recent correction could be temporary.
Bitcoin: 2025 outlook brightens on expectations of US pro-crypto policy
Bitcoin price has surged more than 140% in 2024, reaching the $100K milestone in early December. The rally was driven by the launch of Bitcoin Spot ETFs in January and the reduced supply following the fourth halving event in April.

Best Forex Brokers with Low Spreads
VERIFIED Low spreads are crucial for reducing trading costs. Explore top Forex brokers offering competitive spreads and high leverage. Compare options for EUR/USD, GBP/USD, USD/JPY, and Gold.